
What are harmonic patterns
So, what exactly are harmonic patterns?
Harmonic pattern trading uses chart patterns that can help traders discover pricing trends by forecasting future market movements as part of a trading strategy. They use Fibonacci numbers to generate geometric price patterns to identify possible price shifts or trend reversals. Traders can spot these patterns and use them to help them make their next trade.
There are a variety of chart patterns to pick from and numerous harmonic patterns guide for online traders, each of which can be used to recognise a specific type of trend. However, you should be confident in your ability to undertake your own technical analysis before following any pattern, so that you can always make the best – and fastest – harmonic pattern trading decisions. Here are some of the best harmonic patterns to use in trading:
1. The ABCD Pattern
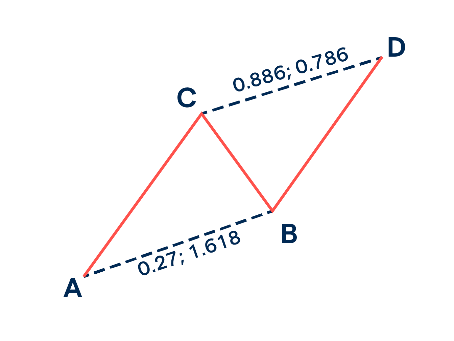
The ABCD (or AB=CD) pattern, which has three motions and four points, is arguably the easiest of all. The impulsive movement (AB) comes first, followed by a corrective movement (BC), and finally another impulsive movement (DC) in the same direction as AB.
The BC leg should reach precisely 0.618 using the Fibonacci retracement tool on the AB leg. The CD line will be the same length as the AB line, and the price change from A to B should take the same amount of time as the price change from C to D. Traders have the option of placing their entry orders at the C point, which is known as the Potential Reversal Zone (PRZ), or waiting until the entire pattern is completed before taking a long or short position from the D point.
2. The BAT Pattern
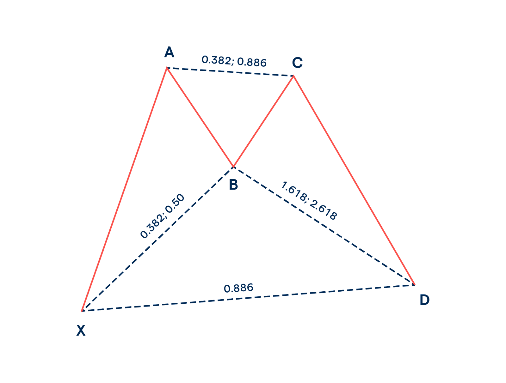
A very common harmonic pattern to use in trading is the BAT pattern. The bat-shaped end product gives the BAT design its name. The BAT pattern, discovered by Scott Carney in 2001, is made up of exact pieces that identify PRZs.
It has one more leg than the ABCD pattern, as well as an extra point called X. A BC retracement action will follow the first leg (XA). You’re probably looking at a BAT pattern if the retracement up to point B stops at 50% of the original XA movement. The CD extension must be at least 1.618 times the BC keg and can go up to 2.618 times. Otherwise, the figure is rejected if the CD extension is less than BC’s. The PRZ is formed by the endpoint (D), which means traders can open positions to trade either a bullish or bearish price reversal.
3. The Gartley Pattern
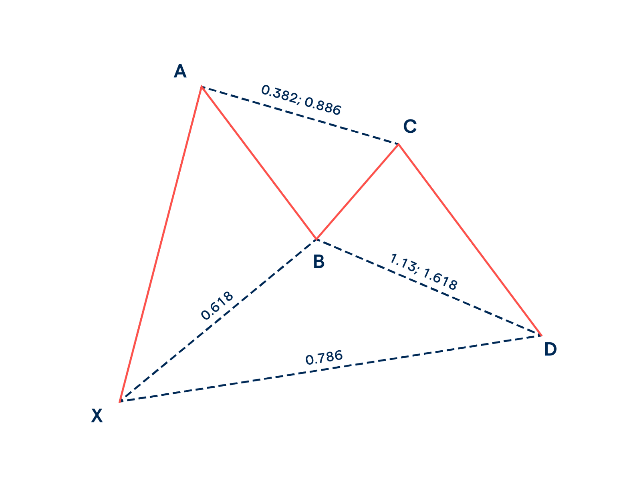
The Gartley pattern was created by HM Gartley and contains two main rules:
Point B’s retracement must be 0.618 of XA.
Point D’s retracement must be 0.786 of the XA movement.
The XA leg leads to a BC retracement, identical to the BAT pattern, except that the retracement of point B must be precisely 0.618 of XA. The take-profit is frequently set at point C, whereas the stop-loss is frequently set at point X.
4. The Butterfly Pattern
Another popular harmonic pattern to use in trading is the butterfly pattern discovered by Bryce Gilmore by combining different Fibonacci ratios to identify probable retracements. It’s a four-leg reversal pattern with the letters X-A, A-B, B-C, and C-D.
The 0.786 retracement of the XA leg is the most significant ratio to define. This aids in the plotting of point B, which will aid traders in locating the PRZ.
5. The Crab Pattern
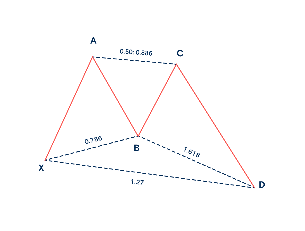
The Crab, another Scott Carney find, follows an X-A, A-B, B-C, and C-D pattern, allowing traders to join the market at extreme highs or lows. The 1.618 extension of the XA movement that determines the PRZ is the most crucial characteristic of the crab pattern.
When the price rises strongly from point X to point A in the bullish version of the Crab, the first leg forms. The AB leg retraces 38.2 percent to 61.8 percent of the XA leg. The pattern is then completed by an extreme projection of BC (2.618 – 3.14 – 3.618), which provides a viable location for pattern completion and likely trend reversal. A bearish crab will look for a drop from point X to point A, then a little price rise, a slight drop, and a rapid climb to point D.
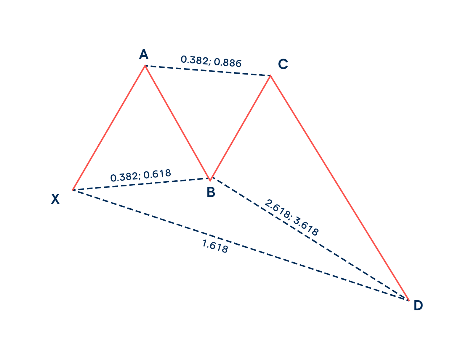
6. The Deep Crab Pattern
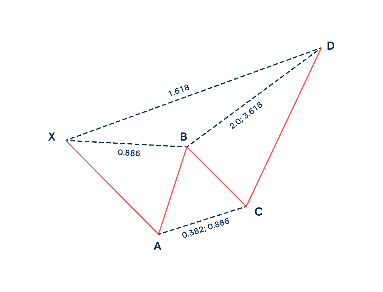
This is a slightly modified version of the previous Crab pattern. The retracement of point B, which must be 0.886 of the XA movement without exceeding point X, is the only difference.
The BC projection can be anywhere from 2.24 and 3.618.
The internet has a plethora of information and harmonic patterns guide for online traders, tips and tricks. But harmonic pattern trading is an art that requires patience and experience. Once you are ready to begin your journey, there are some simple steps to follow with FinLearn Academy’s best harmonic pattern guides and other resource material!
Source: ig.com


