MapMyIndia Grey Market Premium Crosses 80%
Yesterday’s Market Performance 
Nifty: 17,511.30 | -5.55 (-0.03%)
FII Net Sold: INR 1,092.40 crore
Sensex: 58,786.67 | -20.46 (-0.03%)
DII Net Bought: INR 386.63 crore
In today’s issue of the Morning Toast, we discuss:
- CE Info Systems aka MapMyIndia accesses the markets
- Infosys primed for breakout?
- An education concept to keep you chugging along
![]()
CE Info Systems aka MapMyIndia accesses the markets- What’s up & what do you need to know? 🧐
Company overview
- A data & technology products & platforms company, CE Info offers proprietary digital maps as a service (MaaS), software as a service (SaaS) and platform as a service (PaaS)
-
Although the core business focuses on India, the company’s geospatial software and location-based IoT platforms, products & APIs are geography & data agnostic, enabling the company to offer global solutions (~55% revenue)
-
The company has >2000 customers (since inception), with >500 customers for the 6 month period ending Sep 2021 (MaaS, SaaS & PaaS) across global & local technology / non-tech majors (automotive majors, telecom cos, industrials & logistics cos, FMCG players & key government organisations)
- Some marquee customers include Flipkart, Airtel, GSTN, Yulu, HDFC Bank, Hyundai, PhonePe, MG Motor, Avis etc

Source of Revenue
-
The company’s digital maps cover ~6.3 Million SqKms of roads in India, ~98.5% of the country’s road network; likewise, the digital map provides location, navigation, analytics, and other information for 7,933 towns, 6,37,472 villages, and ~17.8 million places across many categories including restaurants, ATMs, hotels etc and ~14.5 million houses/building addresses
-
The company’s major revenues are derived from B2B & B2B2C customers, with the business model designed to charge customers fees per period on a per vehicle, asset, transaction, use case, & user (as applicable)
-
>90% of revenues for year ending 2021, were derived from subscription fees, royalties or annuities for usage of MaaS, SaaS & PaaS (as listed above)
- Maps & other Data Products generate ~45% of overall revenue, with remainder through Platform & IoT Products; heavy usage of products through automotive segment (~40%) with the remainder spread across Corporate (~53%), Government (5%) and Retail (2%)
Financials
-
For the year ended FY21, the company’s net profit more than doubled to ~INR 60 crore (from INR 29 crore), while revenues also grew to INR 192 crores (from INR 163 crores)
-
The company has already recorded a net profit of INR 47 crore and revenues of INR 122 crores for the 6 month period to September 21
-
The company has high contribution margins (average of ~80% for the last three years), with strong EBITDA % in the range of 29 – 35%, with 3 Yr EBITDA CAGR of 16%
-
Given strong operating leverage, the company’s return profile (RoCE) stands out, with 50%, 41% and 110% (no jokes) for FY 19/20/21
Interesting! What’s the future for the company? Promoter Profile & Expertise? 🤔
- As per F&S report, India’s addressable market of digital maps and location based intelligence services is expected to grow to USD 7.7 Bn in FY25, ~15.5% CAGR from 2019-2025, with most growth expected from new policies & actions undertaken by GoI
-
Given global applicability, leveraging IoT and PaaS, the total addressable global market stands at USD 86.5 Bn (2020) and is expected to touch USD 173.6 Bn in 2025
-
As per the DRHP, the company aims to grow using the following strategic direction –
-
Augment products, platforms & tech lead
-
Scale & Expand customer reach
-
Drive expansion in international markets & geospatial sector
-
-
The company has a host of marquee investors including PhonePe, Qualcomm (leading global wireless tech co) and Zenrin (Japanese digital mapping & location tech co), indicative of strong technical expertise
IPO Details? Final thoughts? 🤩
- The IPO (size – INR 1,039 crores) is pure offer for sale (company receives no capital) with current promoters offloading shares; at the higher end of the price band, considering a TTM EPS of INR 16.3, the company is priced at 63x (INR 5,500 crore MCaP)
- The company raised INR 311 crores from its anchor book on December 8, from both global & local investors; the issue opened for the public on December 9, with current grey market premium of >80% of the issue price
- The issue has been oversubscribed ~6.2x on Day 2, with Insti (4.3x), Non Insti (6.3x) & Retail (7.2x) all seeing strong demand
- Mobile navigation devices, wide usage of 3D platforms, and advanced survey technology (digital mapping) are likely drivers towards a more digitally connected future
- The company is well placed to capture market share through current & future product portfolio, limited competitive landscape (locally), first mover advantage and strong promoter / management pedigree (combined >5 decades of experience)
Keep a track?
Like our news coverages?😍 Become a part of our fam, subscribe to our newsletter. Subscribe here
![]()
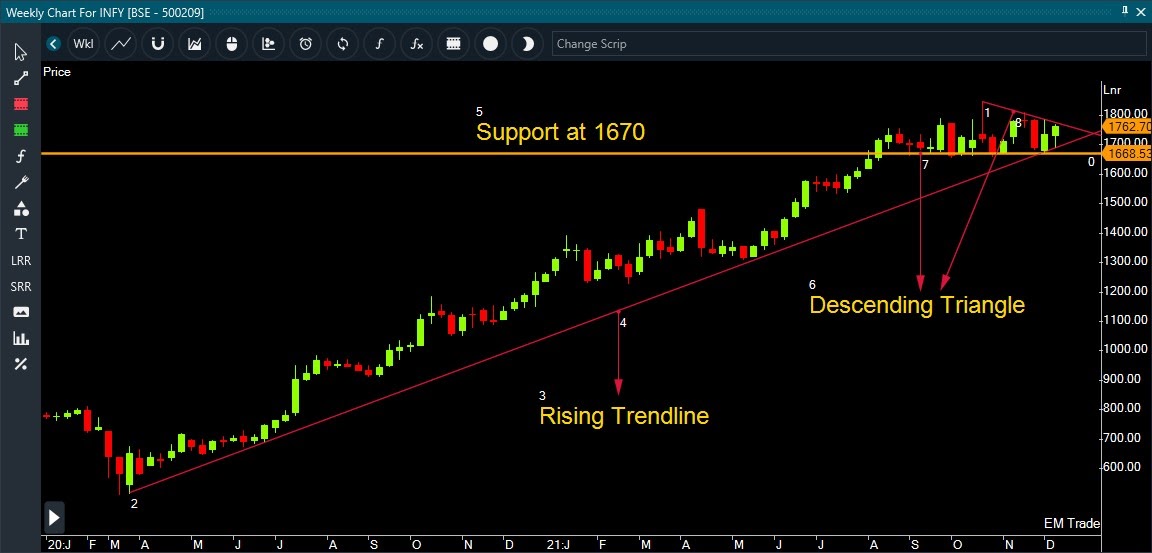
- Analysing Infosys on a weekly time frame, indicates that the stock had been in a constant uptrend, before changing direction (see image below)
-
The stock has been taking support at 1670 for the better part of 2021 after taking support along a rising trendline, making higher highs and higher lows since March 2020
- Prices have been trading in a tight range (consolidation) and facing resistance along a falling trendline, thus making a descending triangle pattern

Awesome! Second confirmations? Any other tools? 🙄
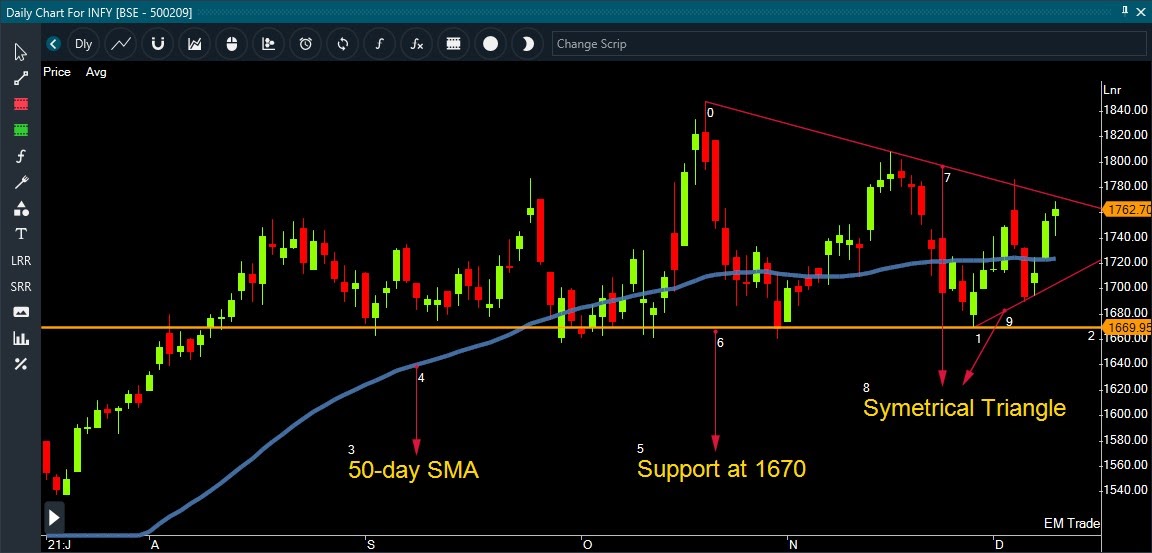
- Looking at the chart on a daily time-frame (see image below), prices have been trading above the 50-day SMA (simple moving average) indicating a positive chart structure
-
Lately the stock has been trading in a tight range (35 trading sessions), facing resistance along a falling trendline and taking support along a rising trendline – forming a symmetrical triangle pattern
-
Prices have sustained above 1670 (important support) for the last 12 months, indicating an accumulation of shares

Interesting! How do I enter / exit such a setup? 🧐
- Going long would be the ideal trade in this case, after prices give a closing above the falling trendline; to avoid traps (bull trap) wait for a retest, defined as prices taking support at the breakout level (highlighted above)
-
Stop-loss should be in place just below the 50-day SMA (trailing stop-loss) and a target as per your RR ratio (2 or more) needs to be set
Interesting! Final thoughts?
- The constant supports taken along the rising trendline and 1670 suggest the stock having a positive chart structure
- On a daily time-frame, prices have been trading in a tight range (accumulation) and making a symmetrical triangle pattern, with continuation above the 50-day SMA showing strength
- We started with overall price action and trend analysis and took second confirmation on moving averages and retests, safeguarding us against possible traps
Keep a track?
What else caught our eye? 👀
Govt won’t leave our airports alone
- The Centre has earmarked a total of 25 airports for asset monetisation over the years 2022 to 2025 under the National Monetization Pipeline
- The criteria was of annual traffic (above the threshold of 0.4 million passengers) and a sizeable ongoing/proposed capital expenditure plan
- The plan is to raise ₹20,782 crore within four years till FY25
Fintech is the place to be
- Niti Ayog CEO believes that the industry will be valued at over $150 bn by 2025 attributing the growth to the Digital India initiative
- The collaborative approach to UPI also allowed many payments startups to flourish, according to him
- He added that the role of the government will be key – both from a regulatory and support perspective
SEBI looking out for algo traders
- SEBI has floated a consultation paper considering a regulatory framework for algorithmic trading by retail investors.
- Topics include use of API access and automation of trades with the aim of making trading safe and preventing market manipulation.
- Algo trading’s share in the Indian financial market has stabilised at about 50%

Weighted Moving Average (WMA)
The Weighted Moving Average (WMA) places more emphasis on recent prices than on older prices. Each period’s data is multiplied by a weight, with the weighting determined by the number of periods selected.
Formula
WMA = ( Price * n + Price(1) * n-1 + … Price( n-1 ) * 1) / ( n * ( n + 1 ) / 2 )
Where: n = time period


