
Technical case study: GSPL
In the recent broader market context, Oil, gas and IT stocks are in strong movement. The oil and gas sector has underperformed, however, with decent correction, Index is hovering around the lower band of consolidation which forms a good risk to reward for an upside move.
Nifty Oil & Gas Weekly Chart
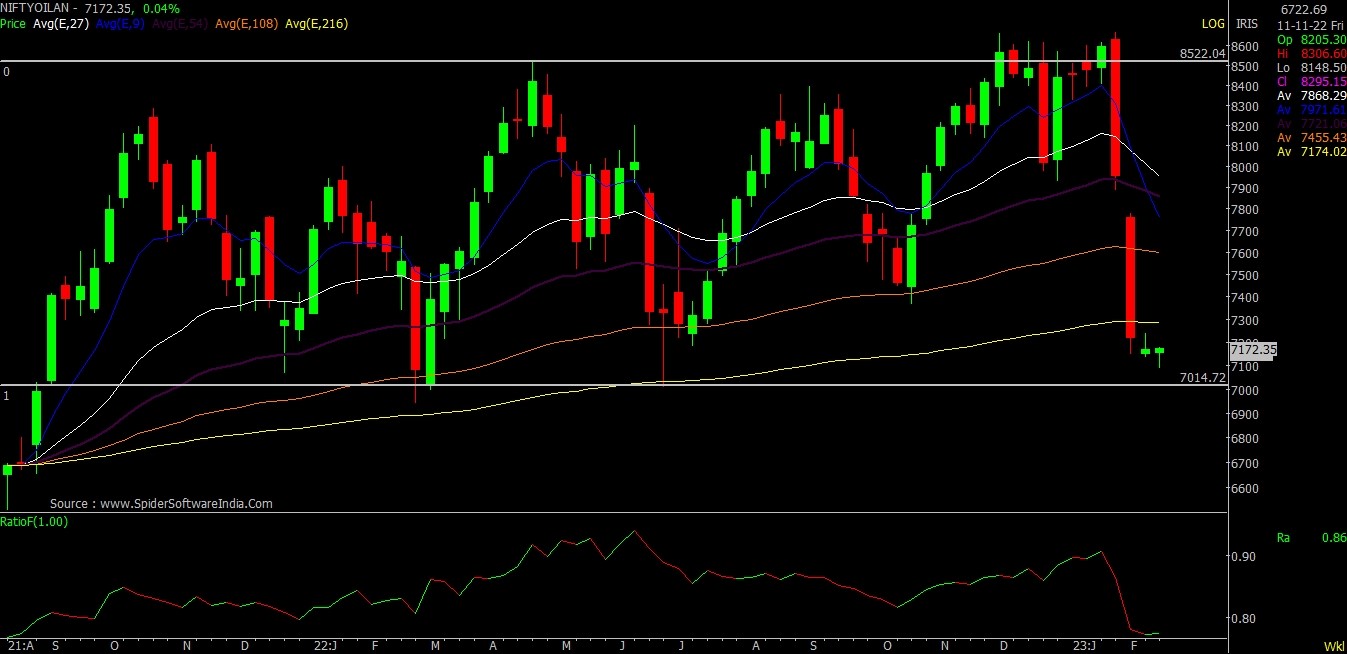
Index has very limited data as it is launched in Jan 2020. The index is consolidating in a broader range of 7000 to 8500 for the past 77 weeks. At this point, Index is at a lower band of consolidation, but some of the stocks like OIL, ONGC and GSPL have started forming a positive structure.
In an earlier note, we talked about OIL and ONGC. Let’s understand the GSPL stock’s structure.
GSPL Monthly Chart
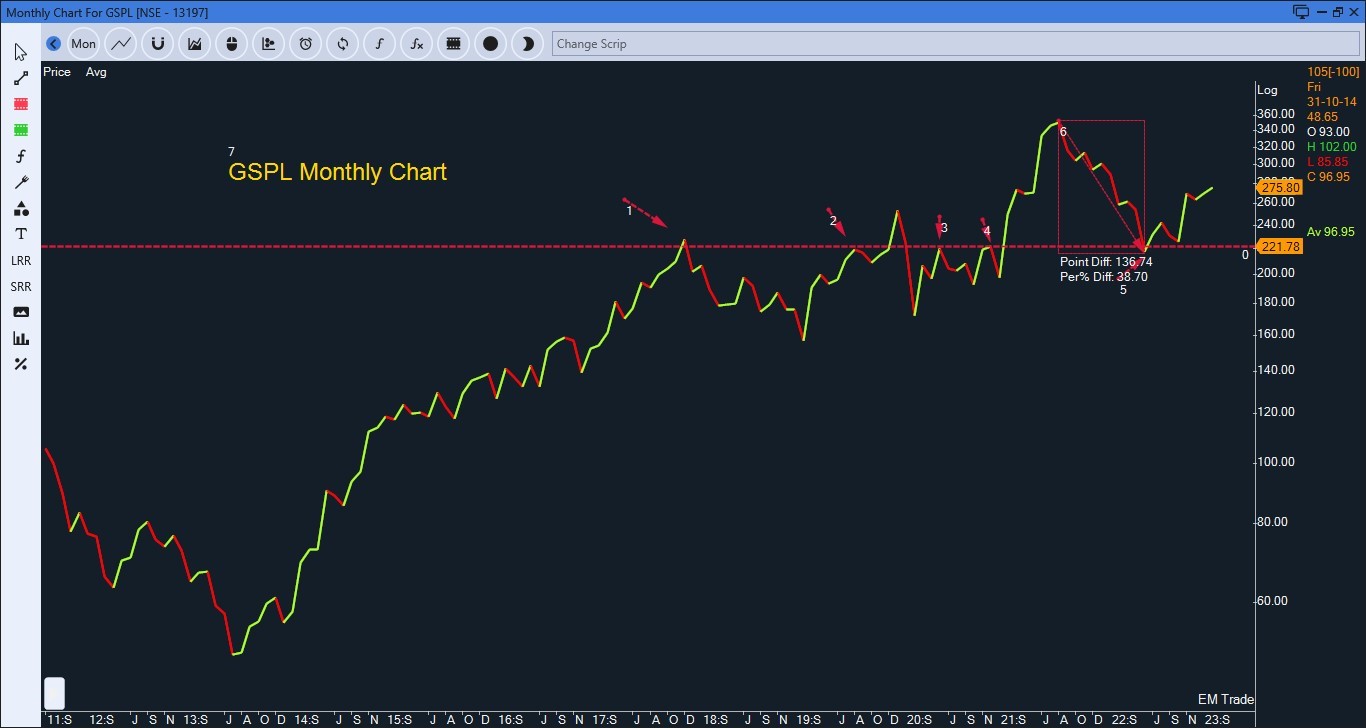
With a 40% correction from the top, the Stock has approached a key support level. The horizontal line is a role reversal support level. The stock has stabilized at the support level followed by a higher high and higher low sequence. It indicates the resumption of a positive move.
GSPL Daily Chart – Price Action
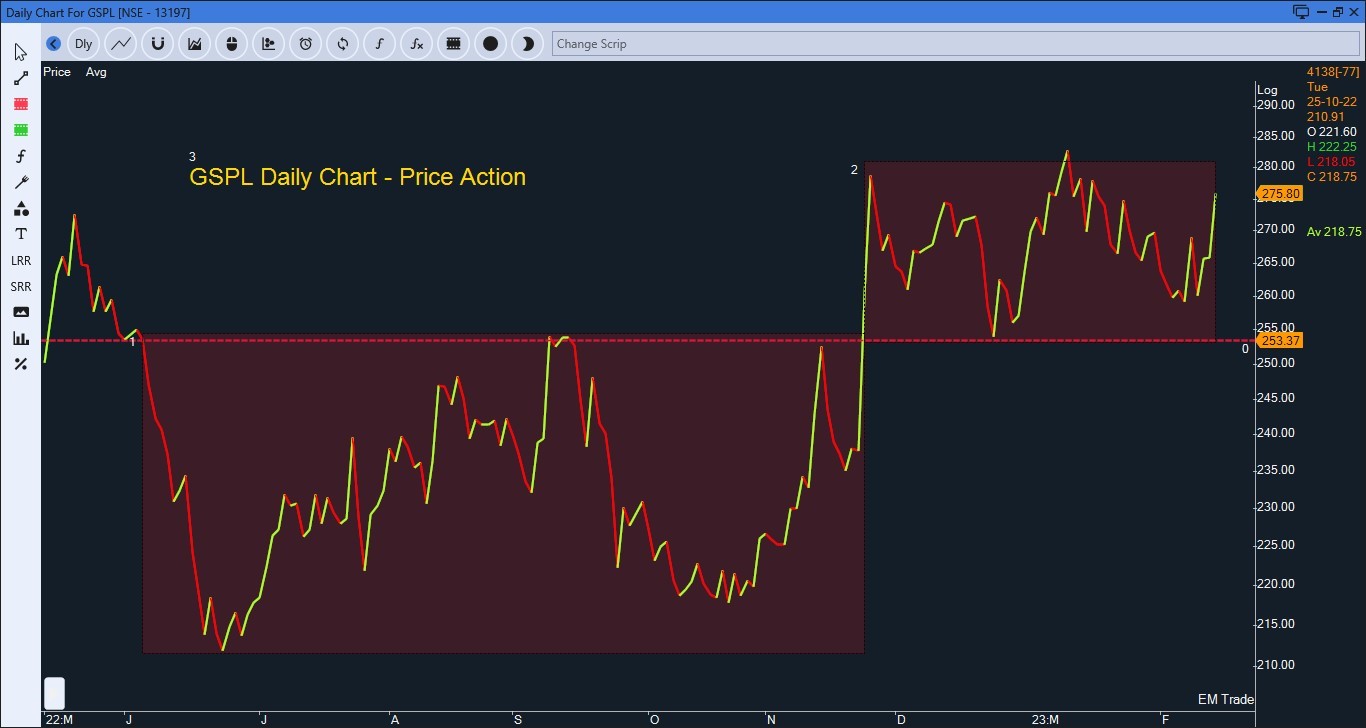
The stock has made a staircase pattern, it indicates base formation followed by a breakout. Stock has retested the breakout level followed by upside movement. Technically, it is known as the role reversal level. It indicates previous resistance level turns out to be a support. These levels are very important as it offers fresh entry opportunity at a lower price.
GSPL Daily Chart – Moving Average
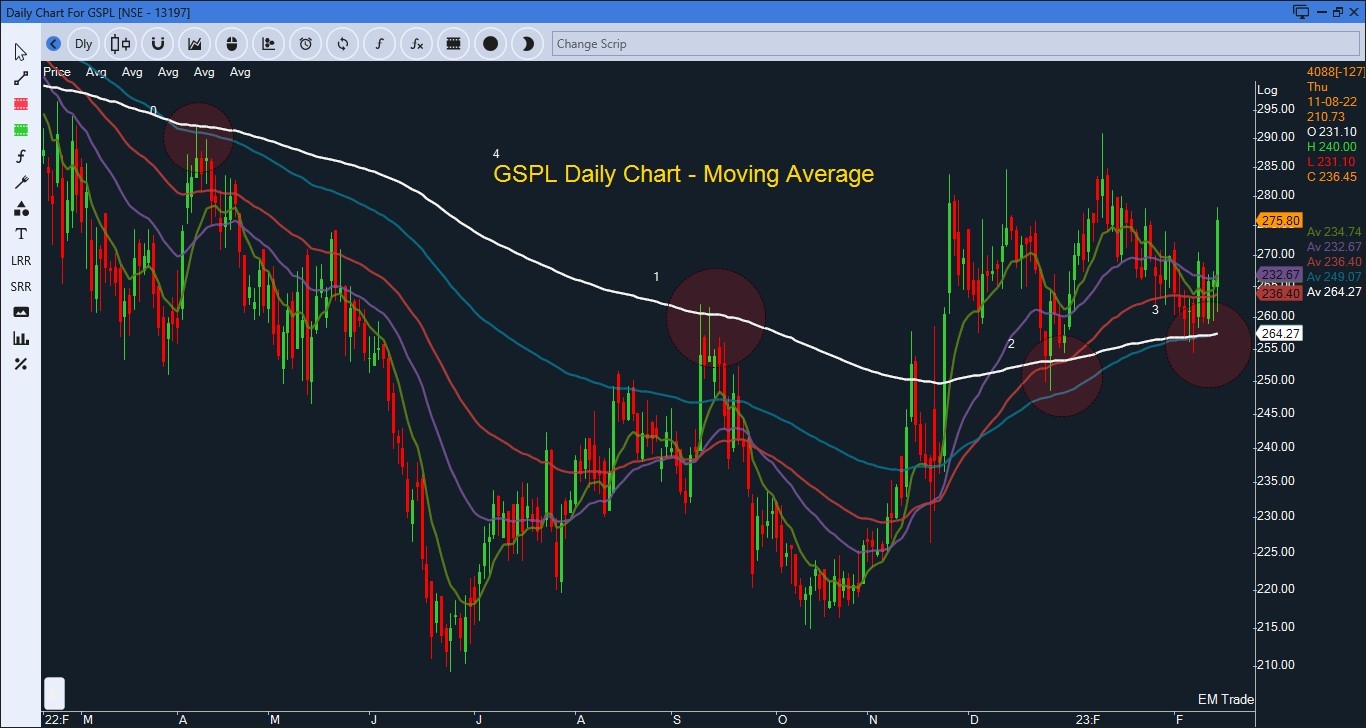
White color moving average is a long-term moving average. The falling slope of the white color was acting as resistance and the rising slope acted as support. A combination of price action and Moving average helps to spot the right opportunity at right time. Price action helps to understand the structure and moving average helps to understand the momentum.
Short-term moving averages are also tilting on the higher side, it indicates traction in momentum on the higher side.
Based on the above technical reasoning, the Stock price will remain in a positive zone as far as sustaining above 260 level. On the higher side, Index has a potential hurdle at 290 and 315 levels.


