
Technical case study: CPSE/OILINDIA
In the recent market context, CPSE stock is at a lower band of consolidation, and some of its stock has started forming bullish reversal signs. This case study includes sector and strength analysis with the use of technical tools.
Nifty CPSE Monthly Chart
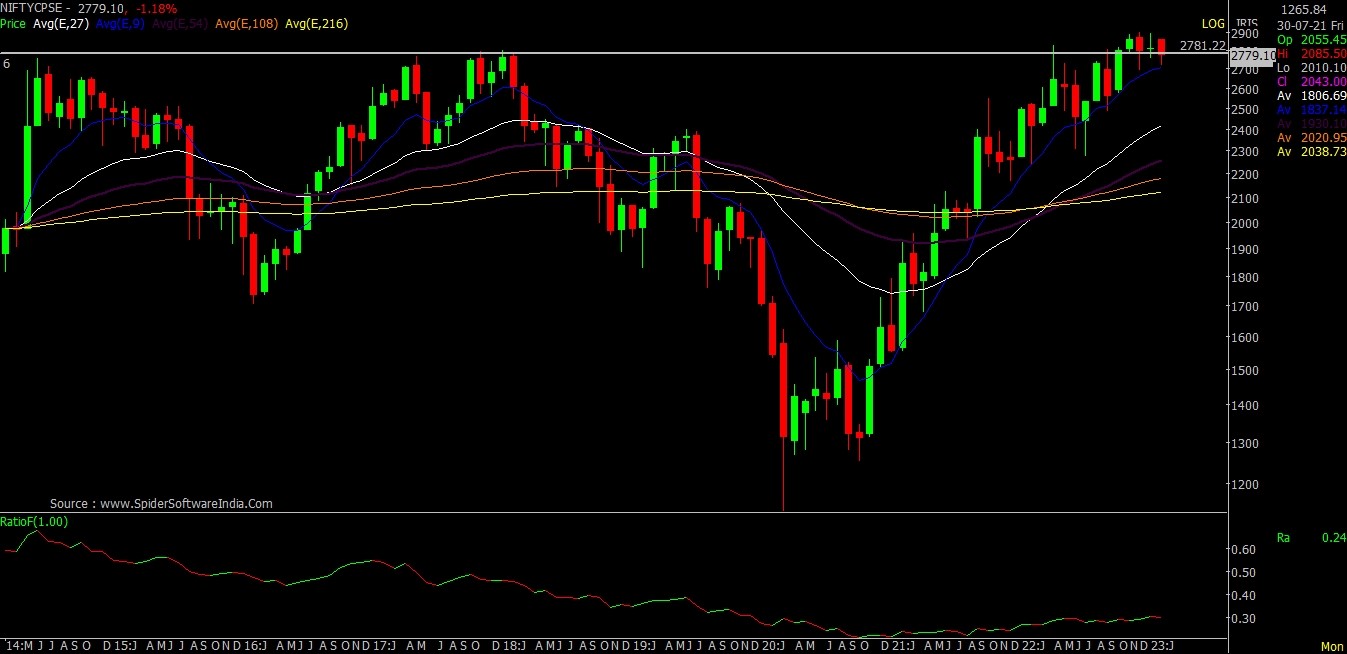
Since the year 2014, the Nifty CPSE index witnessed strong selling pressure at the 2800 level 5 times. A few months back, Index breached the resistance level and hovered around the breakout level.
Nifty CPSE Daily Chart
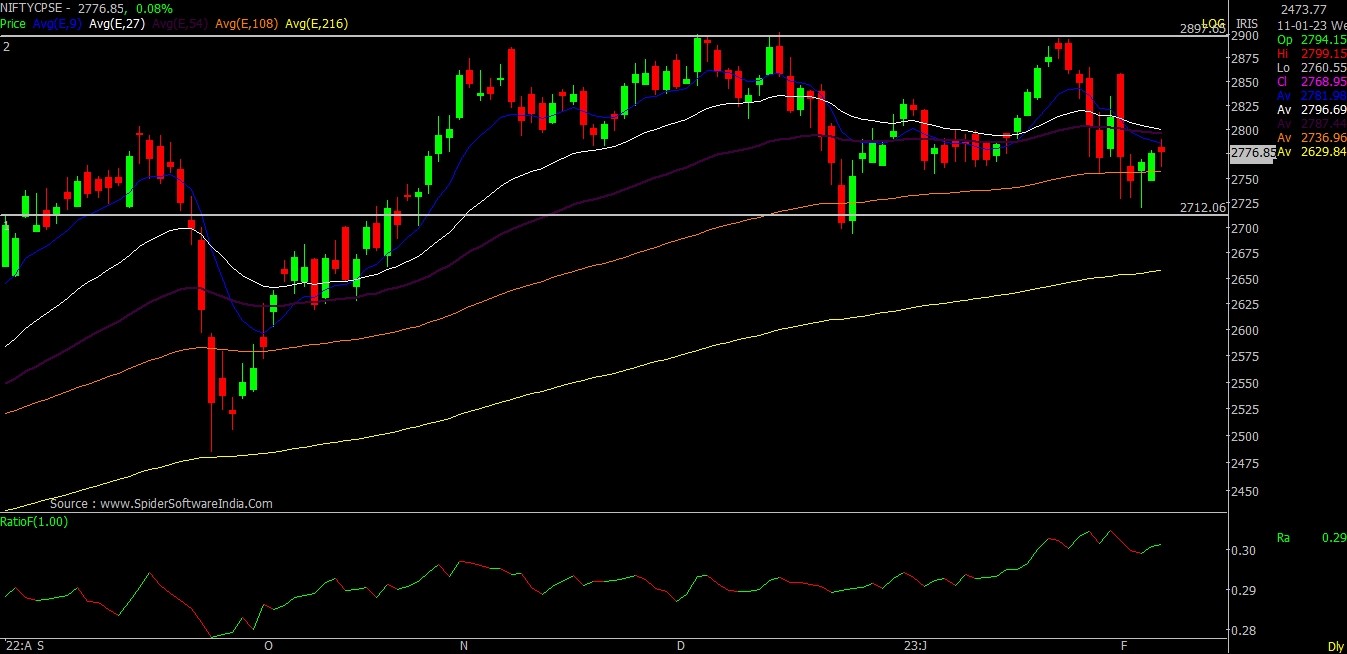
On a daily chart, Index is at the lower band of consolidation with the formation of a hammer pattern which is a bullish reversal sign.
Stock Performance
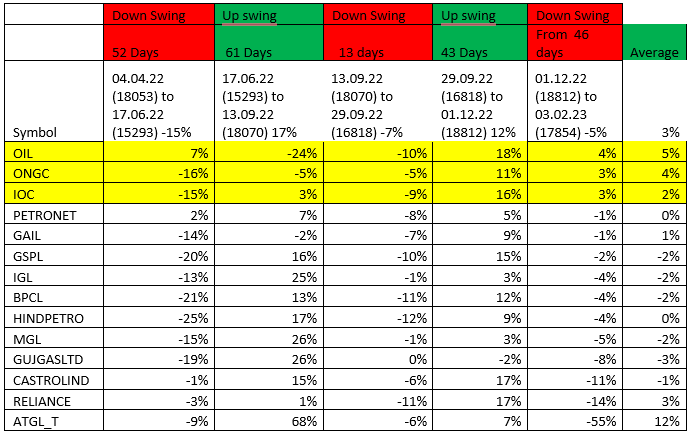
Click here to download detailed Technical Research Report
Price performance helps to understand the strength. Within Oil and Gas sector OIL and ONGC stocks are leading.
OIL Weekly Chart
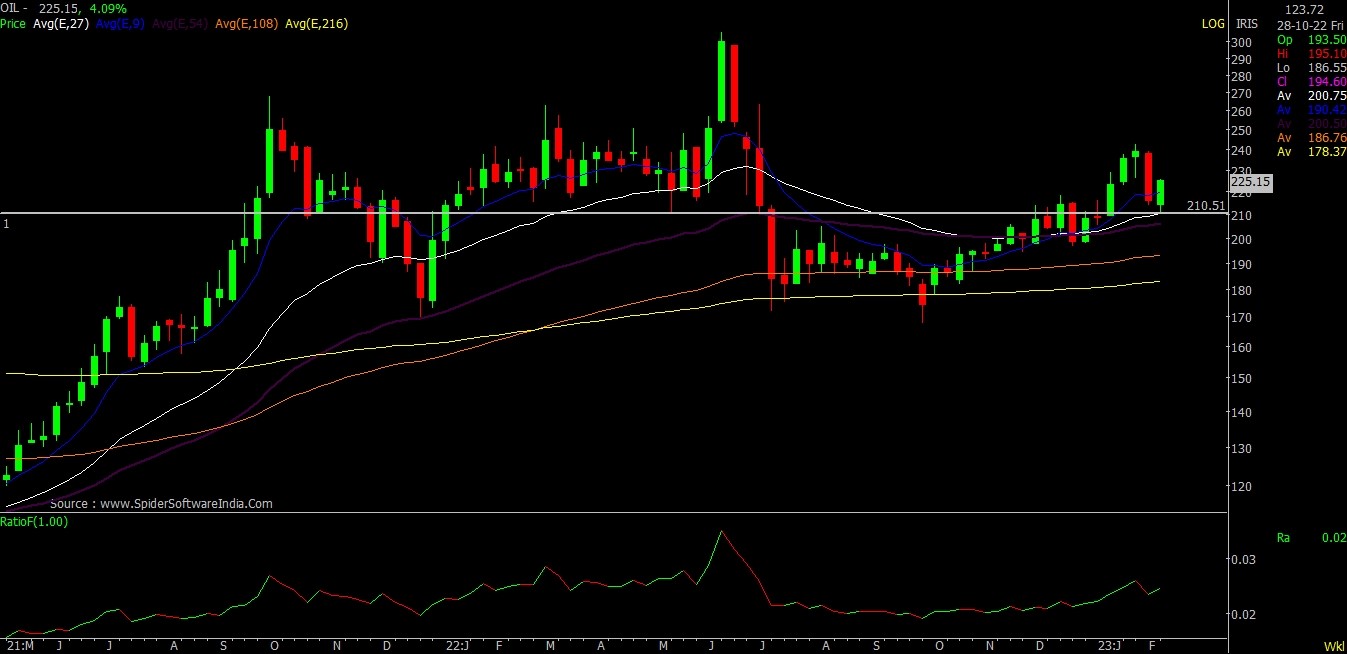
The stock has retested the breakout level followed by a bullish candle formation. Stock is regaining its strength after a mild setback.
OIL Daily Chart
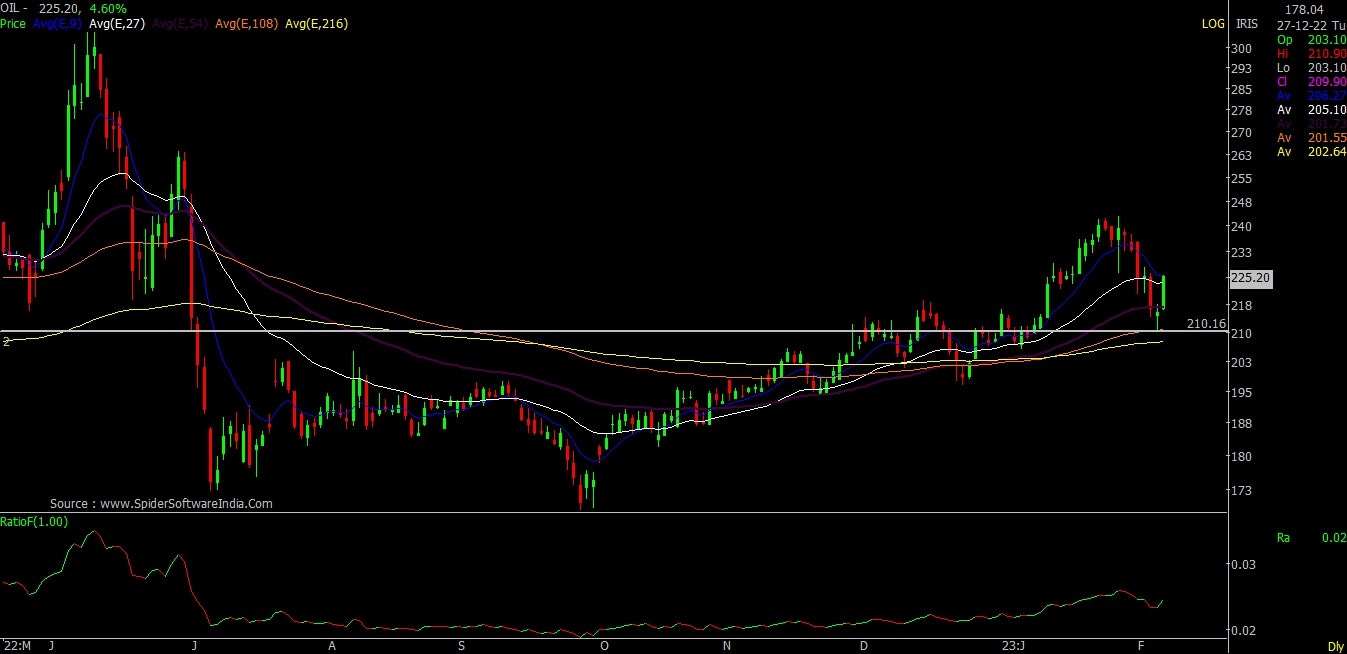
Stock is forming a morning star pattern at the role reversal level. It coincides with rising moving average which indicates the termination of the corrective decline move and the resumption of a fresh northward rally.
Based on the aforementioned rationale, the stock looks good in the range of 225 to 218. The positive view will get negated below the 210 level. On the higher side it has potential resistance is around 240 followed by a 260 level.
The note is for educational perspective.


