

Introduction: The NIFTY 50 index is a well-diversified 50 companies index reflecting overall market conditions. NIFTY 50 Index is computed using the free float market capitalization method. NIFTY 50 can be used for a variety of purposes such as benchmarking fund portfolios and launching of index funds, ETFs and structured products.
Nifty Monthly Chart
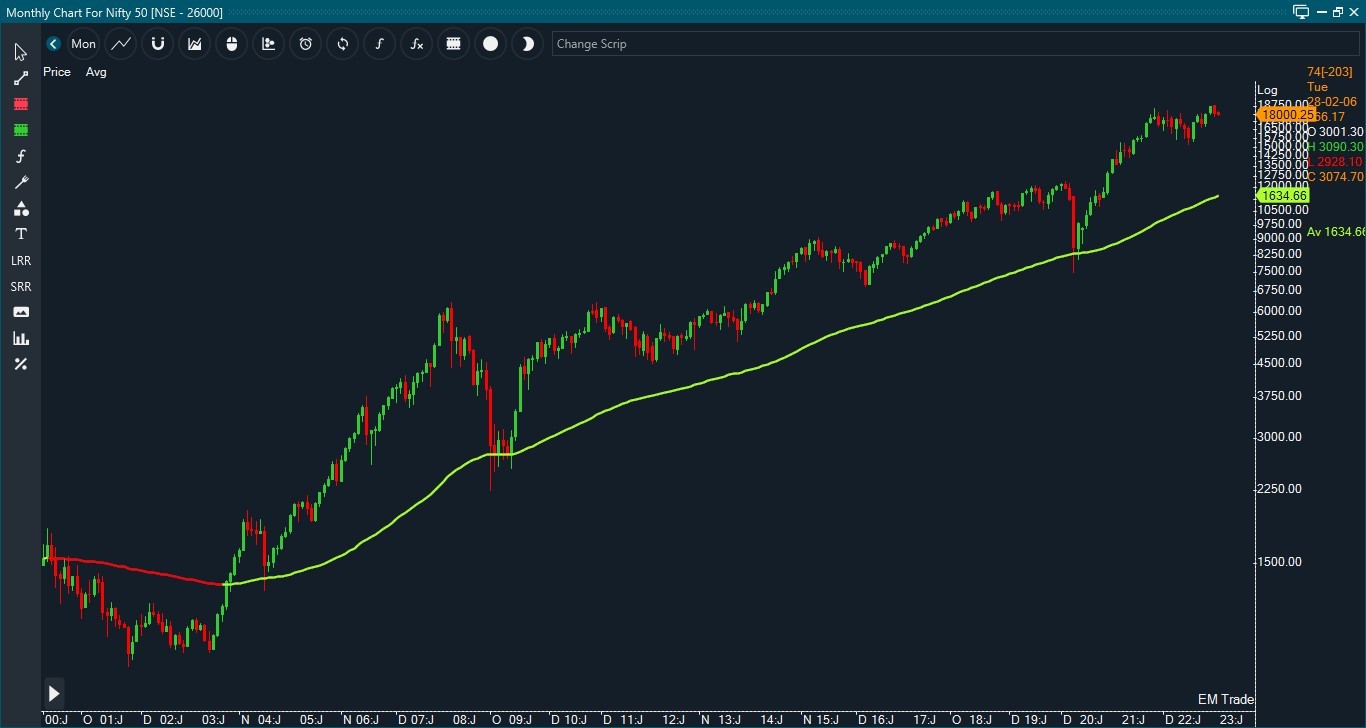
The index took support at 120 EMA during its major fall
Nifty Monthly chart
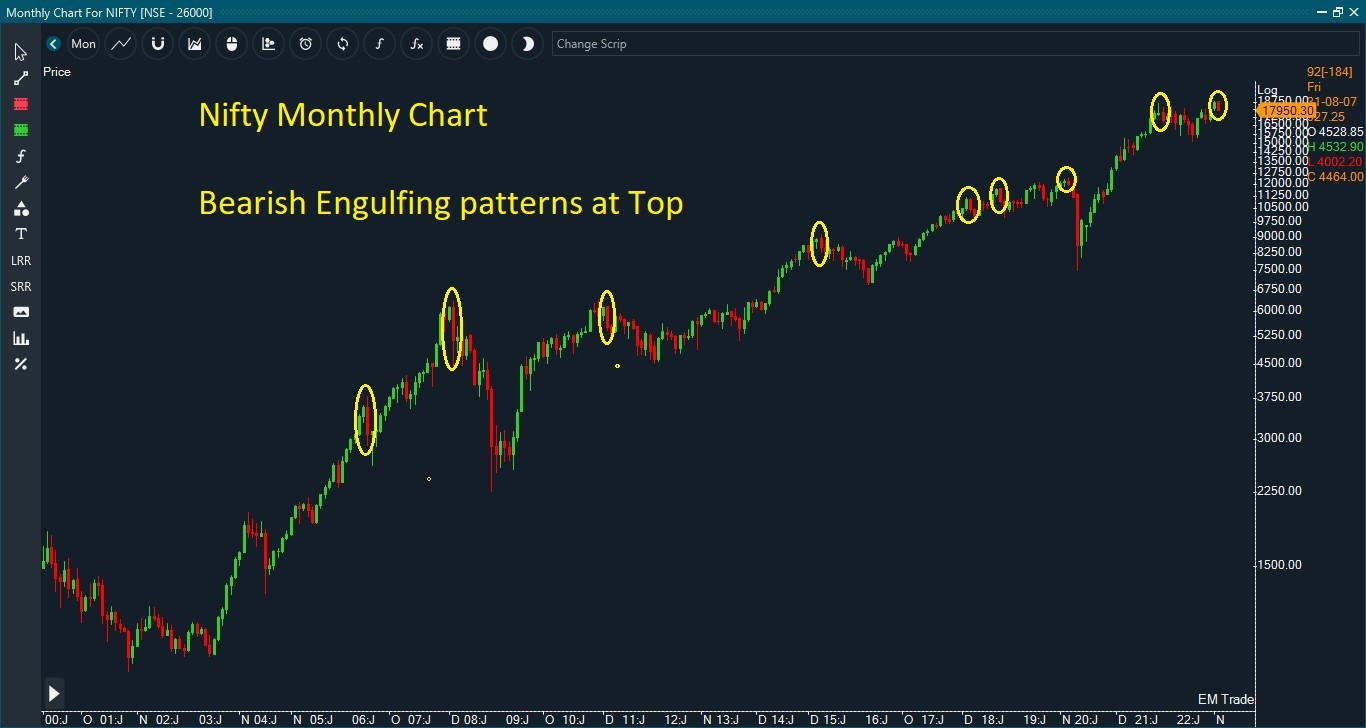
The nifty bearish engulfing pattern on the monthly chart indicated a major reversal sign.
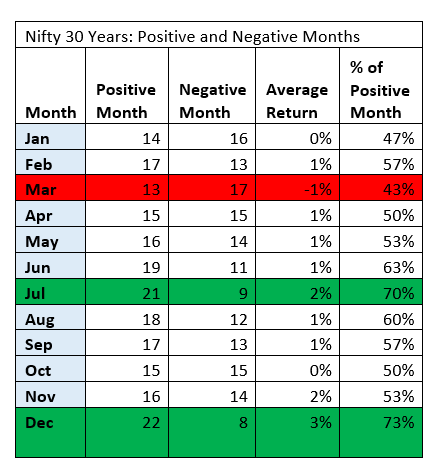
This data indicates December month is usually good for the market with a 73% of positive closing with an average 3% gain followed by July Month. March month has remained the weakest month with a 1% loss

The above data indicates the Percentage movement of Nifty in the defined range. The majority of price fluctuation happened within the range of +5% to -5%, which is 60% of the pie. This data helps to form an option strategy, specifically a short strangle as the trader wants to know the broader range of the market on a month-on-month basis.
+91 8010033033 | info@finlearnacademy.com | Request Callback
Confused what course / style is best suited to you? Unsure whether the course is worth your time?
Hop in and out of sessions for the week to find your groove, and pay the remainder amount of whichever course you prefer OR BOTH (We’re sure you’ll continue!!)
Email ID
Info@finlearnacademy.com
Mobile No.
+91 99300 41883

