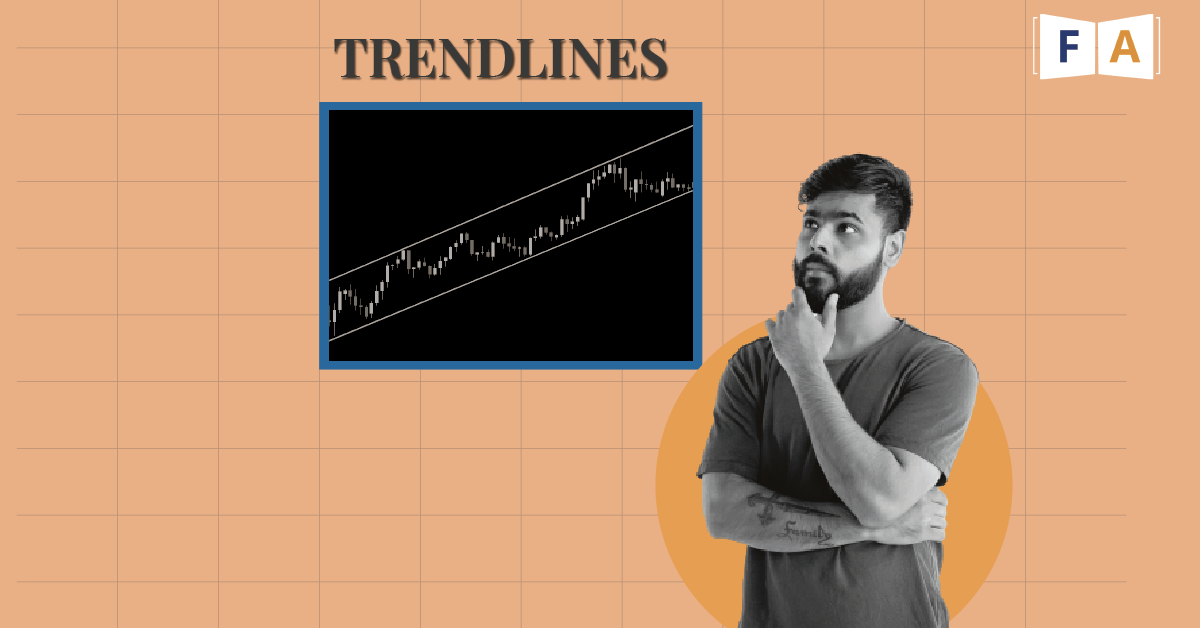
What are trendlines? How can you use them?
Trend lines in trading are drawn above or below the price at an angle. They are employed to provide cues regarding the current trend and show when a trend has altered. The utility of trendlines is that they offer chances to open and close positions as well as serve as support and opposition.
Drawing trend lines
In a downtrend, you draw trend lines higher than the price. In an upward trend, trend lines are drawn below the price. A trend line will be determined by the highs in a downtrend and the lows in an uptrend. To create a trend line in either direction, there must be at least two swing highs or swing lows.
However, at least three highs or lows must be utilised for a trend line in trading to be considered reliable. In essence, a trend line becomes more reliable the more times the price touches it since more traders are utilising it as support or resistance.
Using the candle wicks or bodies
Some traders prefer to utilise the wicks of the candlesticks when drawing trend lines in trading, while others use the candlestick bodies. Although the majority of people will use the wicks, it is also permissible to construct trend lines on a chart using the bodies.
Use whatever you are most comfortable with because trend lines are arbitrary. However, it’s crucial to stick to the strategy you decide on.
Trading with trend lines
Using trend lines for trading typically involves one of two approaches:
- Investing when the trend line serves as support or resistance for the price
- Entering when the price breaks through the trend line
Trend line as resistance or support
When the price returns to a trend line that has been discovered and is acting as support or resistance, you may utilise that line as a point of entry into the market. On the other side of the trend line, a stop loss might be placed. Depending on the method being used, the stop loss size will vary.
Trend line break
The trend line break approach determines an entry based on the line’s actual breakout. A trend line loses its usefulness as support or resistance when the price crosses through it, and it is likely that the price will continue to move in the opposite direction.
Using a trend line break, there are two entry strategies: aggressive entry and a conservative entry.
An aggressive entry
Entering quickly after the candle breaks through and closes on the other side of the trend line is an aggressive strategy to trade using a trend line break. On the other side of the trend line, a stop loss might be set.
A conservative entry
Waiting until the price has crossed the trend line before testing it from the opposite side as support or resistance is a more cautious approach to trade the trend line break.
Caution while breaking trend lines.
It is a good idea to hold off on trading a breakout of a trend line until a candlestick really closes on the opposite side of attempts to use the opposite side of the trend line as support or resistance. It is typically not regarded as a true break in the absence of closing on the other side of the trend line.
What are trend channels? Definition?
The highs and lows of the price movement of an asset define a trend channel, which is a collection of parallel trend lines. The price moves between two parallel trendlines when a trend channel, also known as a price channel, is present. On charts, trading channels can be constructed to help identify upward and downward trends.
The trend line channel is placed above the highs of the price movement in a bullish trend, while the trend line is plotted below the price movement. The trend line channel is below the price action in a negative trend, while the trend line is displayed above.
Different types of Channels
Parallel lines create trend lines channels, which can be ascending, descending, or sideways (ranging).
- Ascending channel (higher highs and higher lows)
- Descending channel (lower highs and lower lows)
- Sideways or horizontal channel (ranging)
Using Trendlines in your trading is of utmost importance. With FinLearn Academy’s courses, you can also become a master and exploit the utility of trendlines.


