What is Support and Resistance?
Points in time where the forces of supply and demand collide are known as support and resistance levels in the stock market. Technical analysts believe that support and resistance levels are essential for assessing market psychology and supply and demand. The supply and demand forces that produced these levels are presumed to have moved when these support or resistance levels are broken, in which case new levels of support and resistance are expected to be generated.

Support
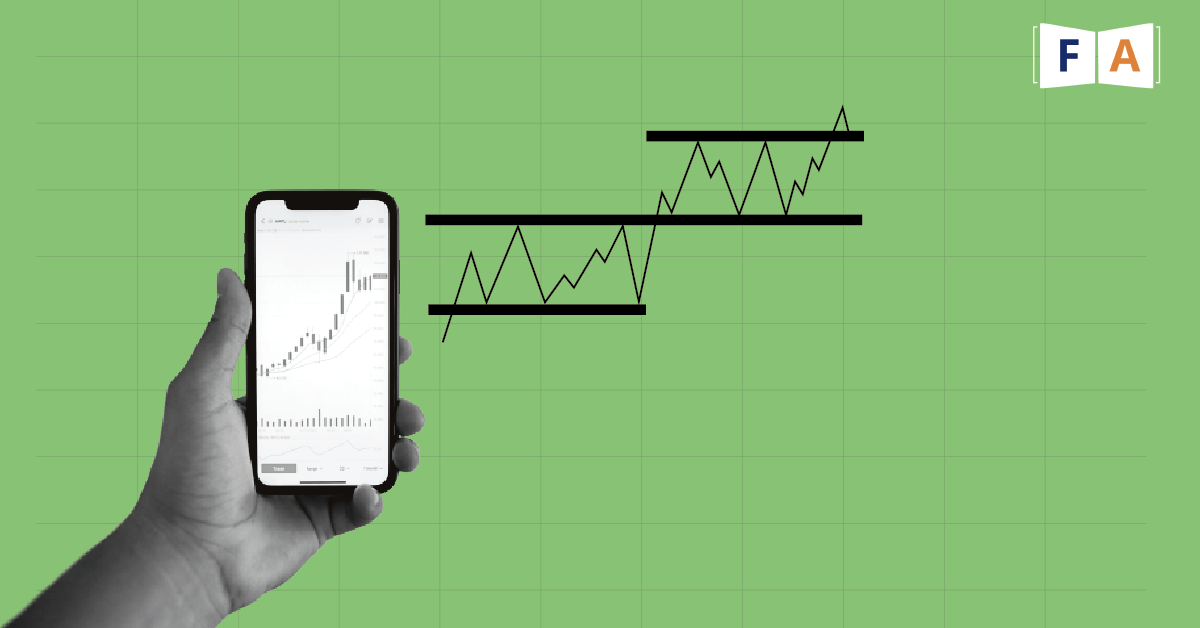
Support is the price where there is enough demand to prevent the stock from going any lower. As seen in the graphic above, the price encounters trouble breaking through the support level each time it reaches it.
According to the theory, when the price declines and gets closer to support, buyers (demand) are more likely to buy and sellers (supply) are less likely to sell.
Resistance
The point of resistance is where supply is sufficient to prevent the stock from rising. As seen in the aforementioned figure, the price has a difficult time rising after hitting the resistance level. According to this theory, consumers (demand) and sellers (supply) become less ready to buy when the price increases and approaches resistance.
Psychology of Support and resistance
To illustrate the psychology of support and resistance, let’s look at a few examples of market players.
Let’s start by assuming that stockholders have been purchasing it at a support zone. Let’s pretend the amount of support is $50. They purchase some stock at $50, and it now rises and leaves that level to reach $55. Buyers are content and eager to purchase more stock at $50 but not at $55. They plan to purchase more if the price drops back to $50. At $50, they are stimulating demand.
Take yet another bunch of financiers. These were the disinterested individuals. They debated purchasing the shares at $50 but decided against doing so. They regret not buying it now that the stock is $55, though. They determine that if it drops to $50 once again, they won’t make the same error and will purchase the stock this time. Potential demand is created by this.
The third group purchased the stock for less than $50; let’s suppose they paid $40. They sold their shares when the price reached $50, only to watch it rise to $55. They want to buy it again at the same $50 price they sold it for in order to reinstate their long holdings.
They are now feeling more like buyers than sellers. They regret selling it and desire to make amends. More demand results from this.
Let’s now make an adjustment to better comprehend resistance. Assume that each of the aforementioned parties owns the shares at $50. Think of yourself as one of the $50 owners. When the stock reaches $55, you choose not to sell. The stock now returns to $50, where you are the owner. What emotions do you have? Do you regret not selling it for $55? The price has now returned to $55, and this time, you sell as much as you can. The other stockholders feel the same way. The stock drops after failing to rise beyond $55.
At least three groups of stockholders are attempting to sell their stock at $55. This establishes a degree of resistance at $55.
These are only a few of the many potential outcomes. All of these situations, as well as the emotions and psychology that go along with them, are presumably familiar to you if you’ve traded in the past. It’s not just you. This is what helps define some of the market psychology underlying support and resistance, as well as technical analysis in general. Countless market participants are experiencing the same emotions and thinking processes as you.
The role reversal between support and resistance in stock trading
The idea that a resistance or support level function is reversed when it is broken is a fundamental one in technical analysis. A support level will turn into resistance if the price drops below it. A resistance level will frequently turn into support if the price moves over it. It is believed that supply and demand have changed, leading the breached level to play the opposite role, as the price swings past a level of support or resistance.
Conclusion
Remember that technical analysis is an interpreted field of study and not an exact science. If you keep learning about technical analysis, someone will probably suggest that it is more of an art than a science. To master it, as with any discipline, requires effort and commitment.
Support and Resistance Levels in the stock market play an important role in trading. With FinLearn Academy’s course on the same, you can become a master in the stock market.


