How to Use Support and Resistance Levels
How to Use Resistance and Support to Improve Trading Decisions
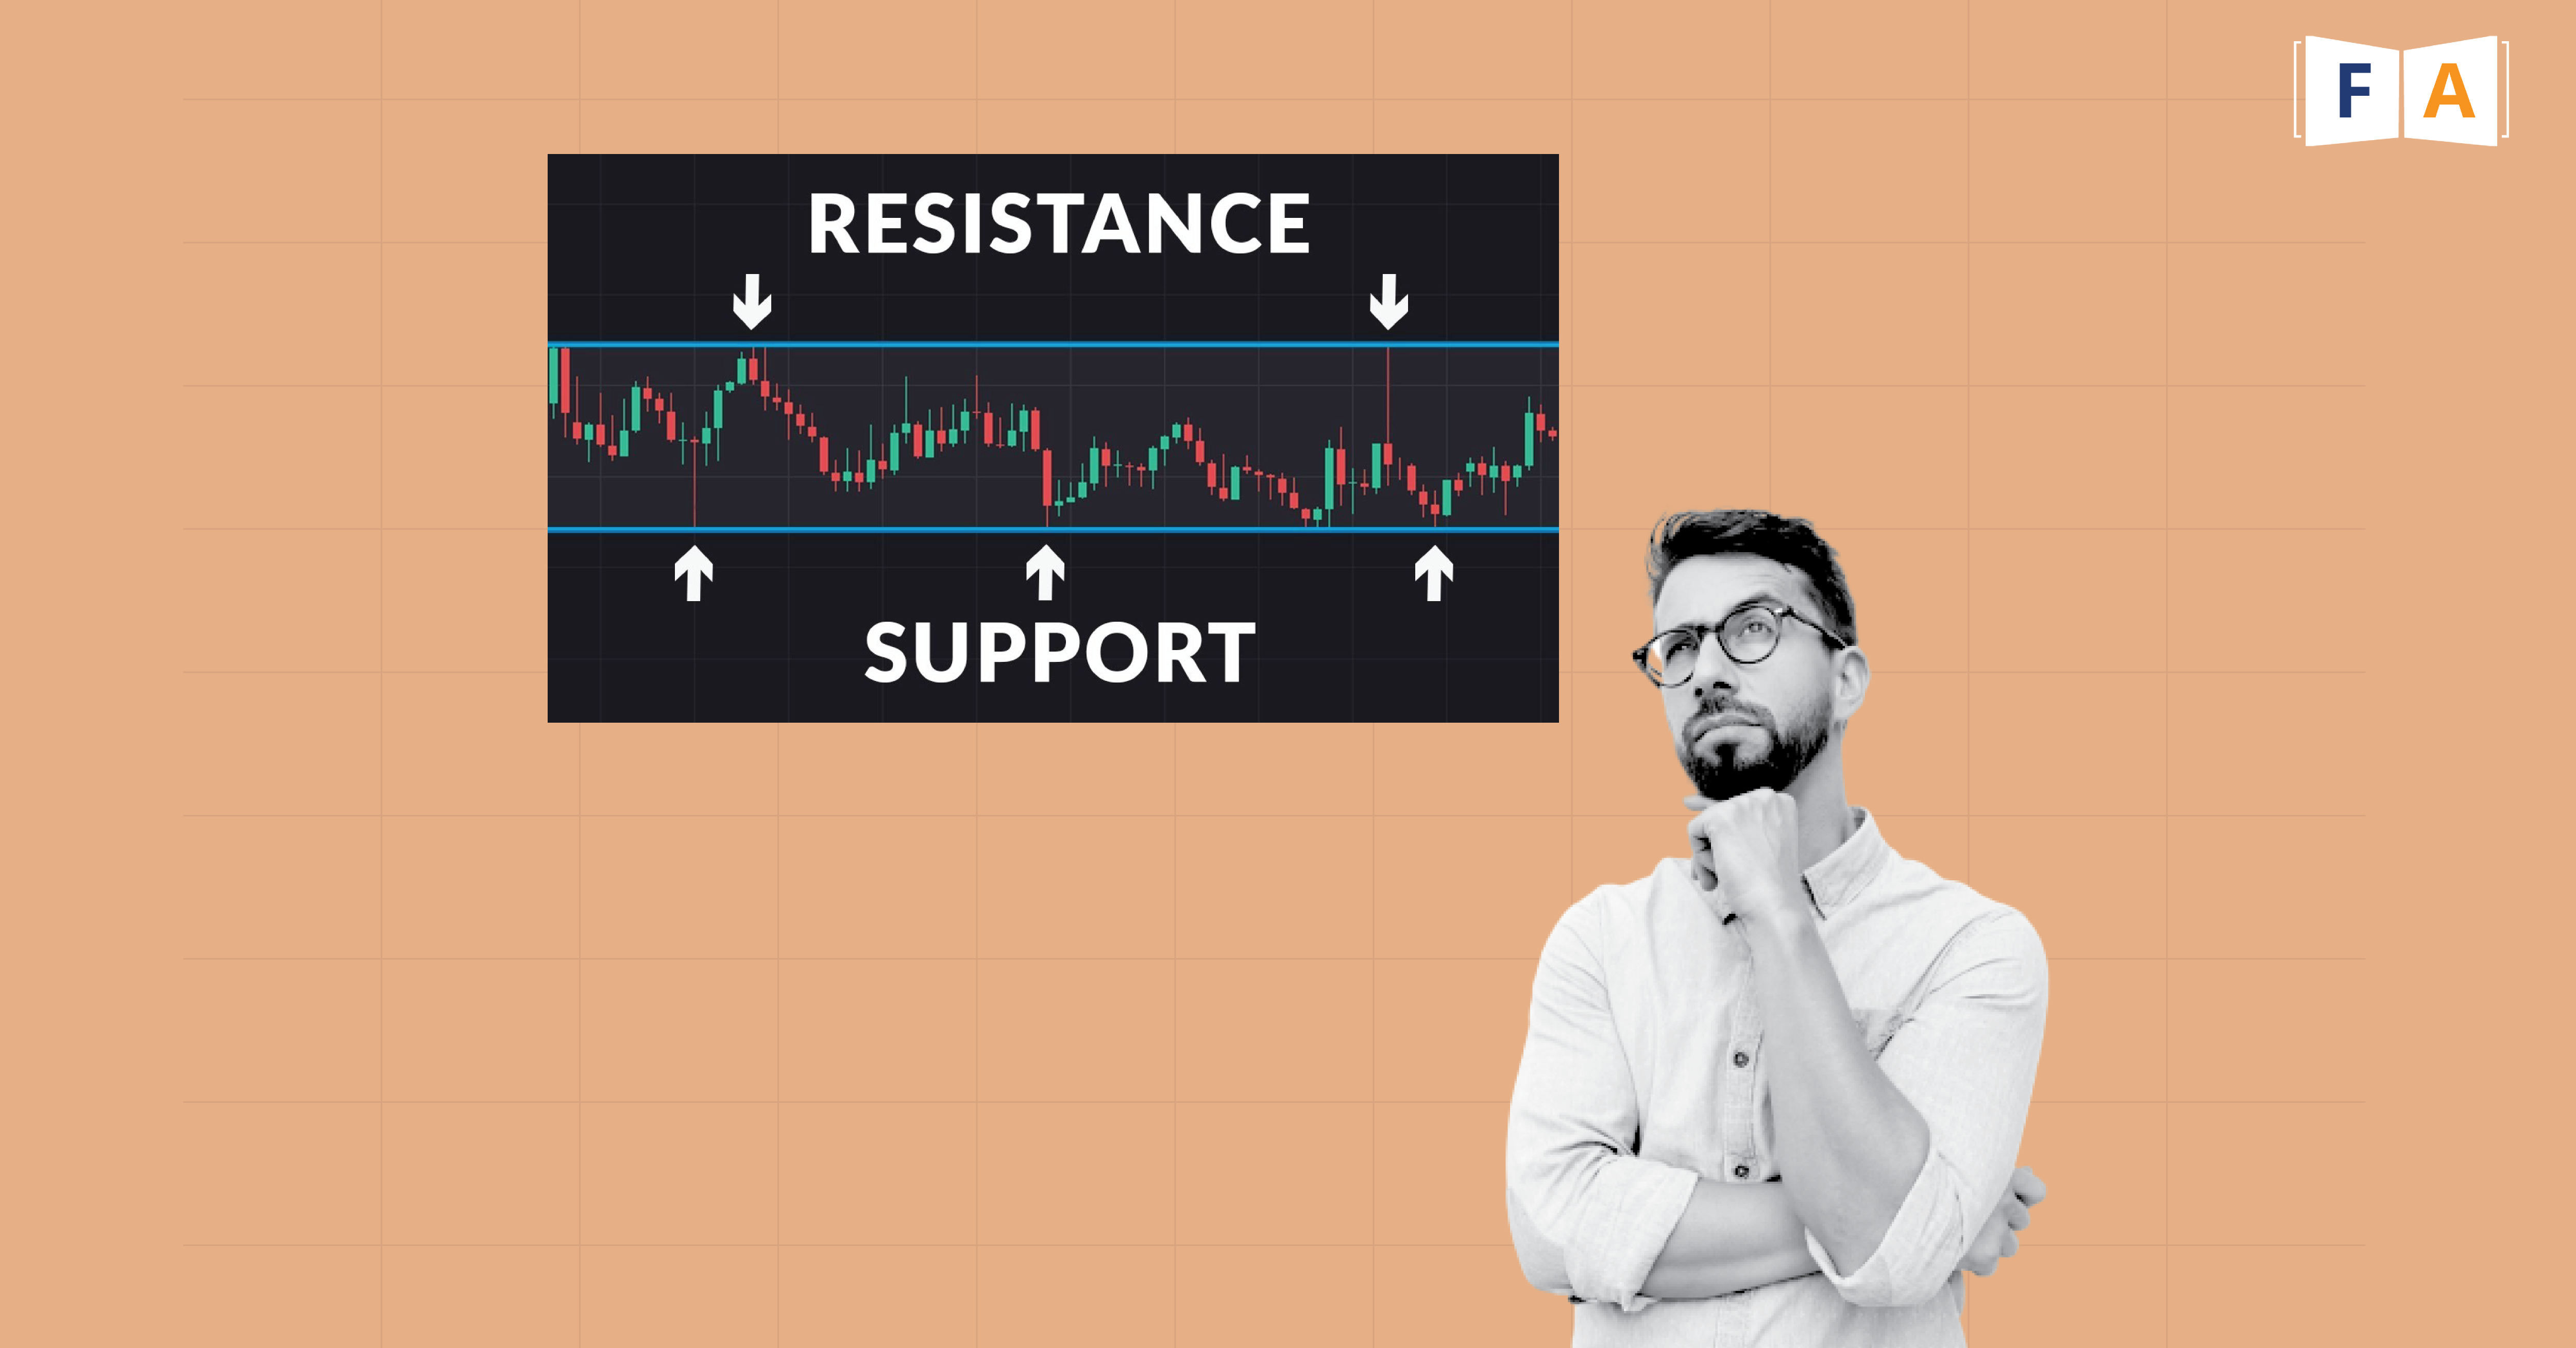
Simply defined, a support region is where an asset’s price tends to stop falling, while a resistance area is where it is likely to start increasing. But before trying to base trading decisions on those regions in a chart, traders need more knowledge of support and resistance than just those basic definitions.
Using Trendlines
“Trendlines,” which can be horizontal or angled, are used to indicate areas of support and resistance. A horizontal line is created to indicate that the market is difficult to move past that area if the price stops and reverses in the same price area twice in a row.“
The price experiences higher highs and higher lows during an upswing. Lower lows and lower highs are made by the price during downtrends. Connect the trend’s highs and lows. Then, extend that line to the right to observe where future support or resistance for the price might appear. 1
Simple lines like this draw attention to trends, ranges, and other chart patterns. They give traders a view of the market’s present movement and potential future course.
Major and Minor Support and Resistance Levels
Minor degrees of support and resistance fail to hold. For instance, if the price is heading downward, it will reach a low, bounce, and then begin to fall once more. The price did stall out and bounce off that low, thus it can be designated as a small support region. However, given the downward trend, it is possible that the price will finally pass through that small support level without much difficulty.
Price levels that have lately resulted in a trend reversal are important locations of support and resistance. The price where the trend reversal occurred is a significant resistance level if the price was going upward before turning downward. A strong support level exists where a downtrend stops and an uptrend starts.
Trading Based on Support and Resistance
Buying near support in uptrends, ranges, or chart patterns where prices are moving up and selling/shorting near resistance in downtrends, ranges, or patterns, where prices are moving down, are the fundamental trading strategies for using support and resistance.
Although it might be profitable to buy or sell at a support or resistance level, neither is guaranteed to hold. Consider holding off until you have some evidence that the market is still treating that area with respect.
When a breakout occurs, you could be able to make more money than if you sold at a small support or resistance level.
False Breakouts
False breakouts present great trading possibilities. One tactic is to wait for a false breakout to happen and then enter the market only then. For instance, if the trend is upward and the price is retracing to a support level, let the price fall below the level and then buy when it begins to rise again above the level. 4
In a similar manner, if a downward trend is present and the price is retracing toward resistance, let the price break through the resistance level before initiating a short sale when it begins to fall below it.
The stop-loss should be positioned a little bit away from support or resistance because false breakouts do happen occasionally. This way, the false breakout is less likely to hit your stop-loss position before moving.
Adapting Trading Decisions to New Support and Resistance Levels
Because support and resistance are dynamic, the trading decisions you make based on them must likewise be. The most recent low and high are significant during an uptrend. A lower low suggests a probable trend change, whereas a new high contributes to the confirmation of an uptrend. Concentrate your efforts on the current support and resistance levels that are significant. Strong areas are where trends frequently run into problems. They might succeed eventually, but it frequently requires time and several tries.
Mark your chart with the current and pertinent minor support and resistance levels as well. You can analyse the present trends, ranges, and chart patterns with the aid of these. As fresh minor support and resistance regions develop, these small levels quickly become irrelevant. Keep adding fresh regions of support and resistance, and get rid of any lines that are no longer valid because the price has crossed them.
If you are day trading, keep your attention on today and avoid getting too caught up in determining where support and resistance were on previous days. Information overload is readily caused by trying to look at too much data. Pay close attention to the current situation and record the support and resistance levels as they emerge.
It takes a lot of experience to balance out opposition and support. In a demo account, try identifying trends, ranges, chart patterns, support, and resistance. Then, practise placing trades with targets and stop-losses. You shouldn’t think about trading with real money until your support-and-resistance trading strategy has been profitable for several months.


