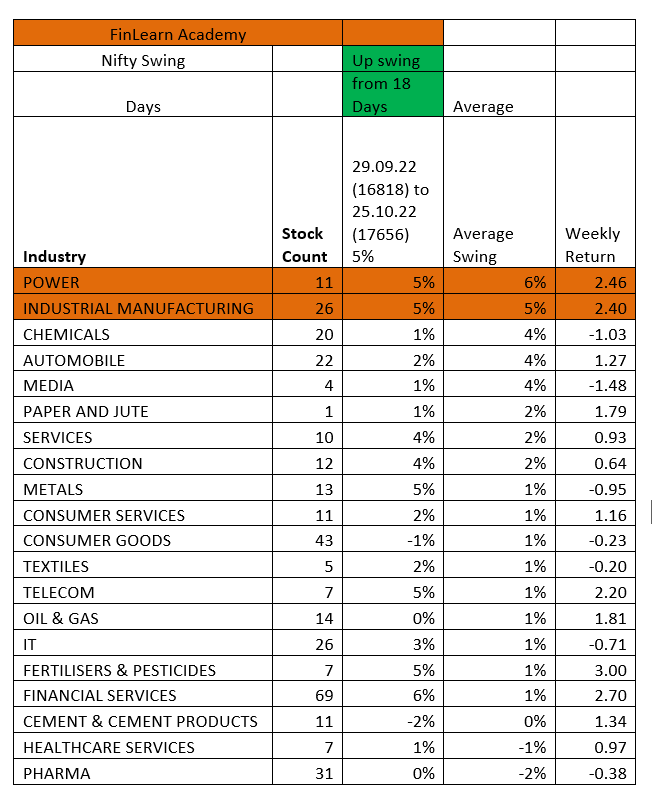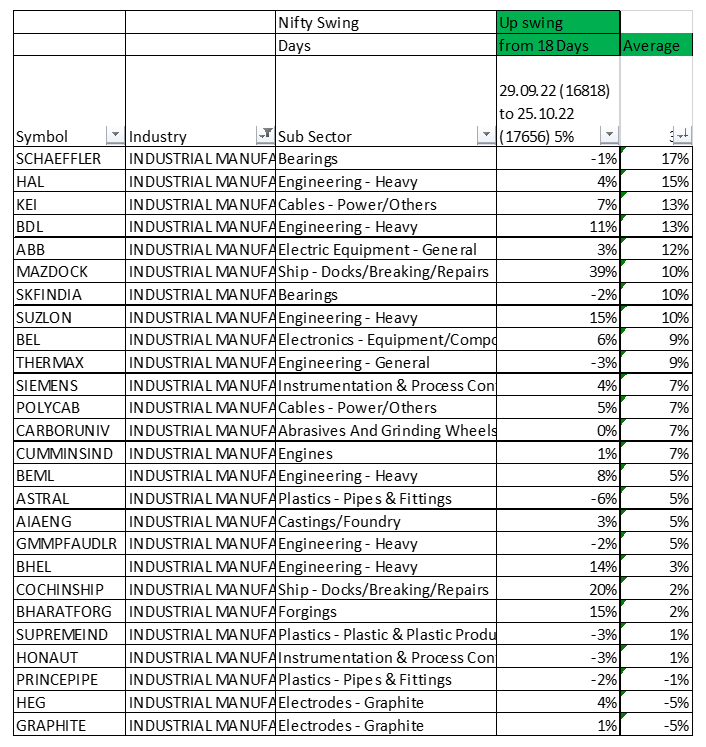


This is to understand the strength of sectors and stocks followed by the technical aspect. Here we compare sector movement along with the broader market and another sector in terms of price performance.

This document is to understand the strength of sectors and stocks followed by the technical aspect. Here we compare sector movement along with the broader market and another sector in terms of price performance.

The purpose of the above exercise is to understand the strong sector and find strong stock within the sector.
Let’s have a look at the technical aspect of stock
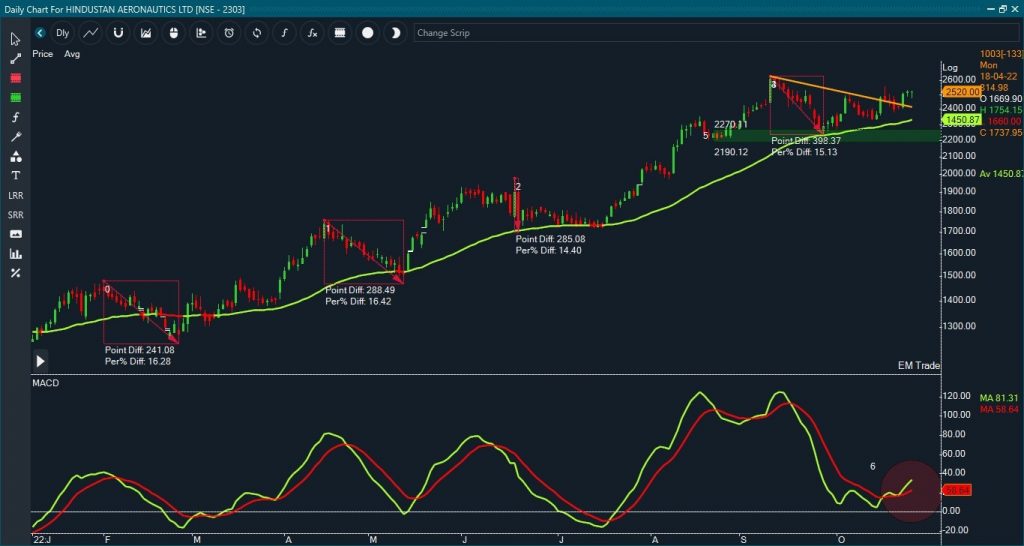
HAL Daily Chart

The market is moving northward and financial stocks are at the helm. But Industrial manufacturing and power stock have a consistent performance on the higher side. Looking at HAL Stock, for the past 10 months stock is in strong upside movement. In between, the stock has corrected 4 times around 15% followed by upside movement. A midterm moving average is acting as a trend navigator for the stock.
The intensity of the recent decline is 15%, which is in line with the previous fall. The stock rebounded from the support band which coincides rising moving average. So, the recent bottom is significant as multiple technical factors harp on the same string.
The stock has breached the falling trendline which indicates a resumption of an impulse move.
From the oscillator perspective, MACD has a positive crossover in the positive zone, indicating a bullish continuation sign.
+91 8010033033 | info@finlearnacademy.com | Request Callback
Confused what course / style is best suited to you? Unsure whether the course is worth your time?
Hop in and out of sessions for the week to find your groove, and pay the remainder amount of whichever course you prefer OR BOTH (We’re sure you’ll continue!!)
Email ID
Info@finlearnacademy.com
Mobile No.
+91 99300 41883

