
Technical case study on Dabur
The NIFTY FMCG Index is designed to reflect the behavior of FMCGs Indian companies from (Fast Moving Consumer Goods) (FMCG) sector. It includes companies that deals with those goods and products, which are non-durable, mass consumption products and available off the shelf.
FMCG share in Nifty 50:
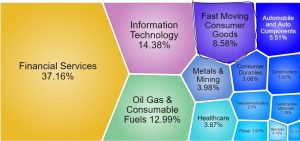
FMCG sector carries almost 9% weight in index. It fall under top 5 sectors of Nifty.
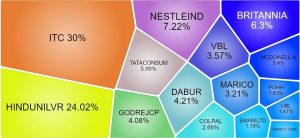
FMCG Sector Composition:
Tech Fact: FMCG Monthly Chart
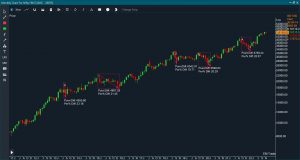
Since year 2013, It has been observed that Nifty FMCG sector has 5 major decline movement around 20% fall followed by strong recovery. Recent fall was about 21%, which inception point of recent rally.
Technical chart: FMCG Monthly Chart
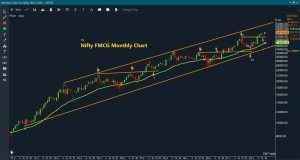
FMCG sector’s entire trajectory can be confined within rising channel. Recently, Index gave breakout above previous high, indicating bullish continuation sign. Stock took support at rising moving average, it has acted as trend navigator to index and gave cushion in intermediate declines. Looking at broader structure, Nifty FMCG sector looks positive.
About Dabur
Dabur India is one of the leading fast moving consumer goods (FMCG) players dealing in consumer care and food products. Dabur India Limited is the fourth largest FMCG Company in India and the world’s largest Ayurvedic and Natural Health Care Company with a portfolio of over 250 Herbal/Ayurvedic products.
Tech Fact: Dabur Monthly Chart
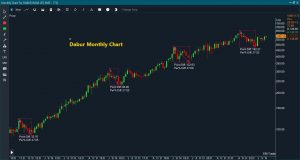
Since year 2011, Stock witnessed 4 major fall, which were around 27% followed by upside movement. After a recent decline of 27%, Stock formed strong green candle showing presence of buyer at key support level.
Technical Chart: Dabur Monthly chart
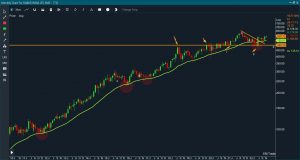
After intermediate correction of 27%, stock took support at role reversal level. Earlier, Stock’s price level of 500 has acted as resistance which turned out to be support level for recent decline. Horizontal support line also coincides with moving average. As a follow up sign, Stock has breached tiny falling trendline indicating resumption of positive movement.
Technical chart: Dabur Weekly Chart
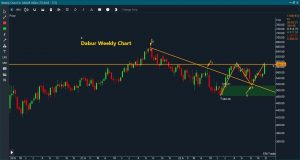
Stock has started to respect support. Moving above 590 level will be considered as positive breakout on the stock. Above 590 level, Stock has potential resistance at 660 level. Bull’s will hold their ground as far as price sustain above 560 level. Moving below 560 level can be considered as weaking strength of bulls.


