Know your Index: NIFTYBANK
About NiftyBank
The NIFTY Bank Index comprises the most liquid and large Indian Banking stocks. It provides investors and market intermediaries with a benchmark that captures the capital market performance of the Indian banks. The Index comprises of maximum 12 companies listed on the National Stock Exchange of India (NSE).
NIFTY Bank Index is computed using the free float market capitalization method. NIFTY Bank Index can be used for a variety of purposes such as benchmarking fund portfolios and launching index funds, ETFs and structured products. Index Variant: NIFTY Bank Total Returns Index.
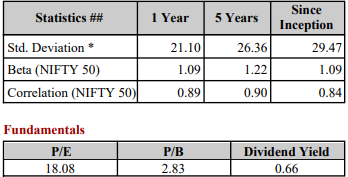
Statistical and Fundamental Value
Index Component
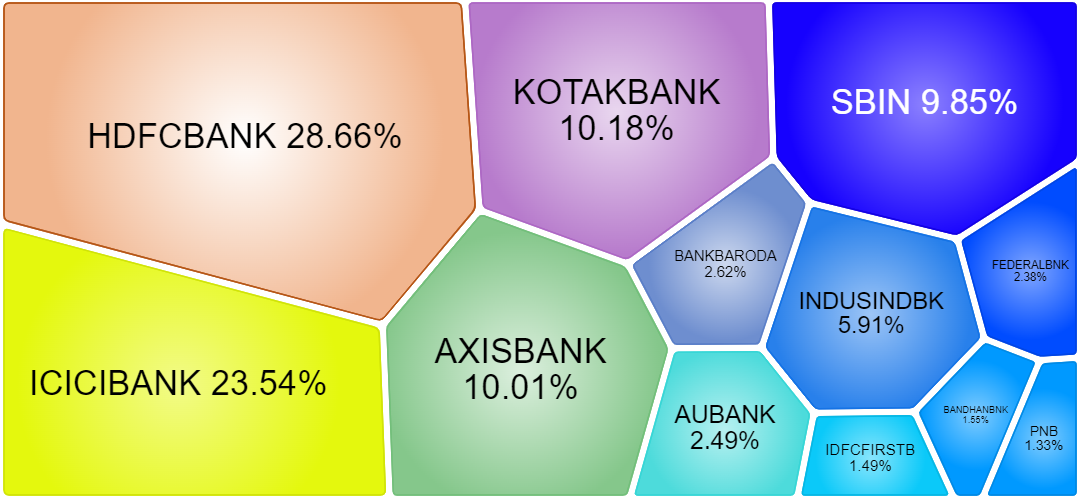
Source: Niftyindices
Seasonality of Nifty Bank
| Month | Positive Month | Negative Month | Avg Return | Positive Month Ratio |
| Jan | 13 | 10 | 2% | 57% |
| Feb | 9 | 14 | -1% | 39% |
| Mar | 13 | 10 | 0% | 57% |
| Apr | 16 | 7 | 3% | 70% |
| May | 12 | 11 | 2% | 52% |
| Jun | 12 | 11 | 0% | 52% |
| Jul | 16 | 7 | 3% | 70% |
| Aug | 13 | 10 | 0% | 57% |
| Sep | 12 | 11 | 3% | 52% |
| Oct | 15 | 8 | 2% | 65% |
| Nov | 16 | 7 | 4% | 70% |
| Dec | 14 | 9 | 3% | 61% |
The above data indicates, February month has been the weakest month with 39% of positive closing. November month has been the strongest month with 70% closing with a 4% return followed by April and July.
Monthly Frequency Distribution of Nifty Bank’s return
| Monthly Frequency Distribution of BankNifty | ||
| Above 25% | 1 | 0.4% |
| 21% to 25% | 5 | 1.8% |
| 16% to 20% | 9 | 3.3% |
| 11% to 15% | 25 | 9.1% |
| 6% to 10% | 44 | 15.9% |
| 0 to 5% | 79 | 28.6% |
| (-1) to -5% | 69 | 25.0% |
| (-6) to -10% | 27 | 9.8% |
| (-11) to -15% | 11 | 4.0% |
| (-16) to -20% | 0 | 0.0% |
| (-21) to -25% | 5 | 1.8% |
| Below -26% | 2 | 0.7% |
| Total Months | 276 | 1 |
Based on 23 years of history, 53% of the month gave a return between -5% to =5%. The highest return was 45% whereas the lowest return was -34%.
Technical Properties of Nifty Bank Chart
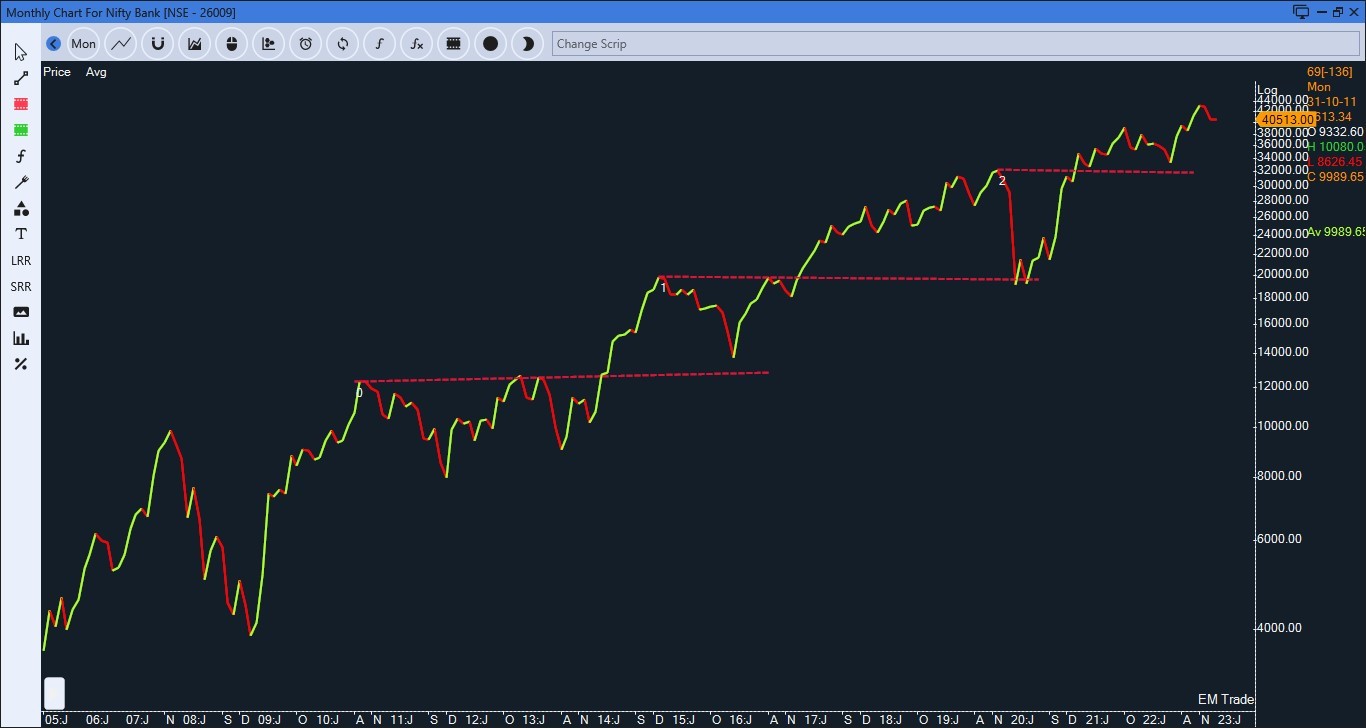
Chart 1: Rising Channel with the intensity of fall
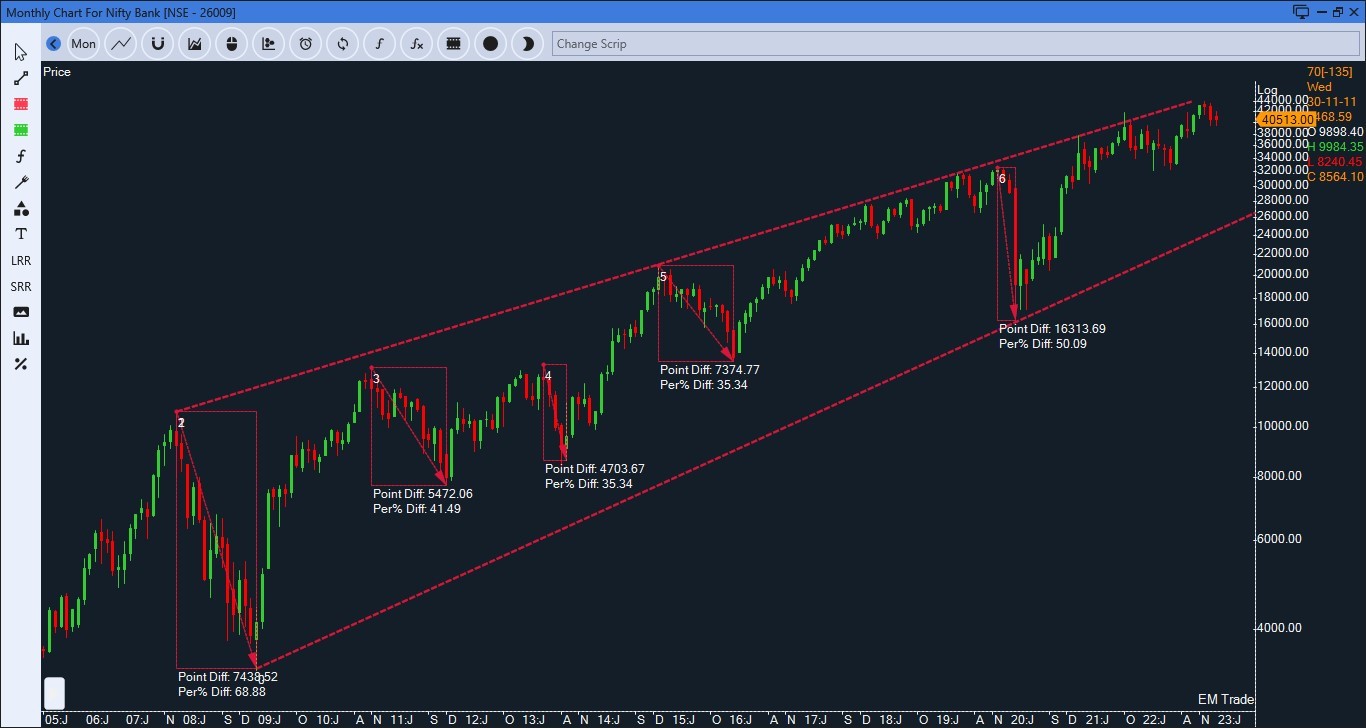
The index has been moving in a rising channel. At this point, Index is at the upper band of the channel but it may not be considered as resistance as the price may have a reaction but continued to touch the upward slope of the line. A breach of the base has indicated negative movement for the index.
It has strong fall during Global Financial Crises (GFC) by 70%. It has an intermediate correction of 35% to 40% followed by 50%.
Chart 2: Nifty Bank Base
The index has shown strong buying when Index corrected to the upper band of consolidation.


