
Know your Index: NIFTY IT
What’s the Nifty IT Sector?
1. Captures the performance of the Indian IT companies
2. Comprises of 10 IT companies
3. Computed using free float market capitalization method with a base date of Jan 1, 1996
4. Used for various purposes such as benchmarking fund portfolios, launching index funds, ETFs and structured products.
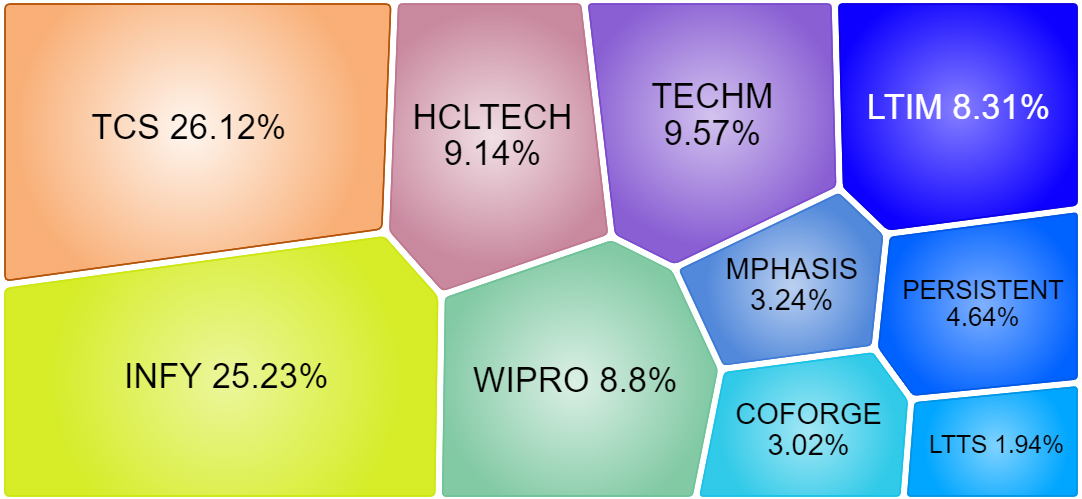
Components of the IT index with Weightage
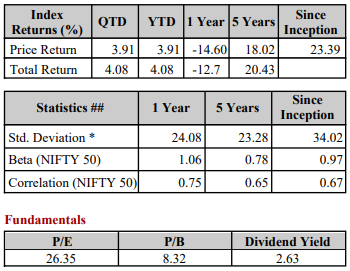
Stats
Seasonality of IT Index (21 years Data)
| Month | Positive Month | Negative Month | % Positive Month | Average Gain |
| Jan | 13 | 8 | 62% | -1% |
| Feb | 10 | 11 | 48% | -1% |
| Mar | 12 | 9 | 57% | -2% |
| Apr | 8 | 13 | 38% | -1% |
| May | 8 | 13 | 38% | 1% |
| Jun | 13 | 8 | 62% | 1% |
| Jul | 13 | 8 | 62% | 3% |
| Aug | 14 | 7 | 67% | 3% |
| Sep | 13 | 8 | 62% | 1% |
| Oct | 11 | 10 | 52% | 2% |
| Nov | 14 | 7 | 67% | 4% |
| Dec | 15 | 6 | 71% | 4% |
The seasonality table indicates that the IT sector performed well in November and December, whereas April and May are weak months.
Let’s deep dive into the properties of the Nifty IT sector
Nifty Yearly Chart
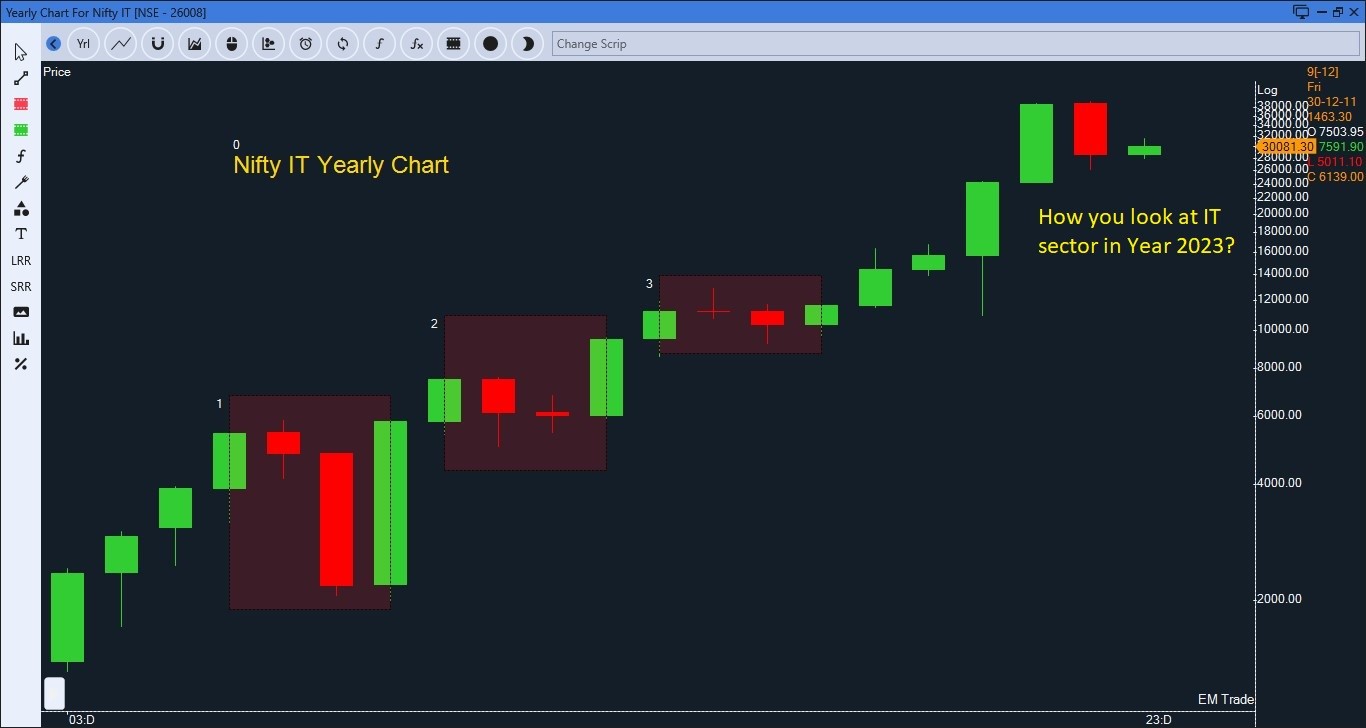
In 21 years of history, Index has declined 3 times. Each time, Index fell for 2 consecutive years. The year was a negative year. Based on history, the Year 2023 may see pain or underperformance.
Nifty IT Quarterly Chart – Time-wise Rise and Correction
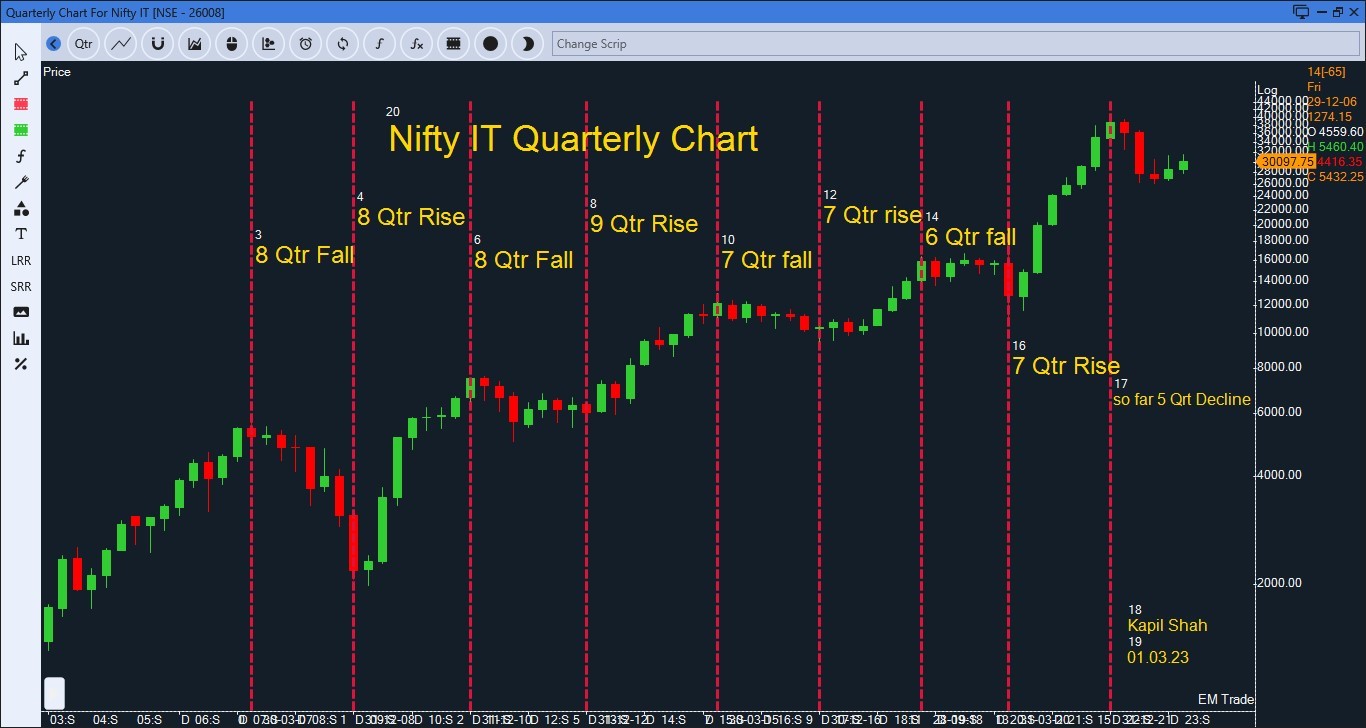
Since the year 2016, Nifty IT Sector has moved in 8 quarters (+/- 1) up and down cycle. It means almost 8 quarters of an upside move followed by 8 quarters of a downside move. Recently, the IT index is in a downswing for 5 quarters.
Nifty IT Monthly Chart (Based on the intensity of fall)
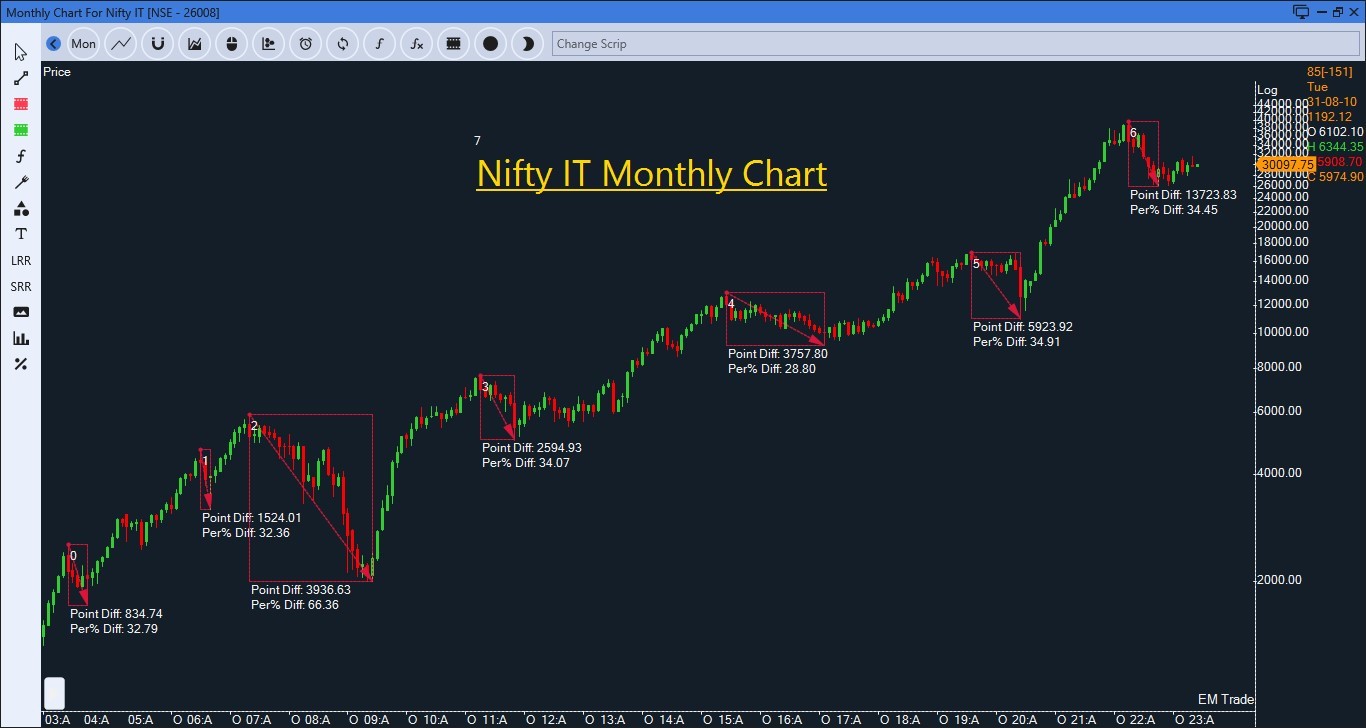
The IT sector has 7 major declines in its lifetime. 6 out of 7 declines ranged from 30% to 35%. The recent decline is also 35%.
Nifty IT Weekly Chart (Ft. Rising channel)
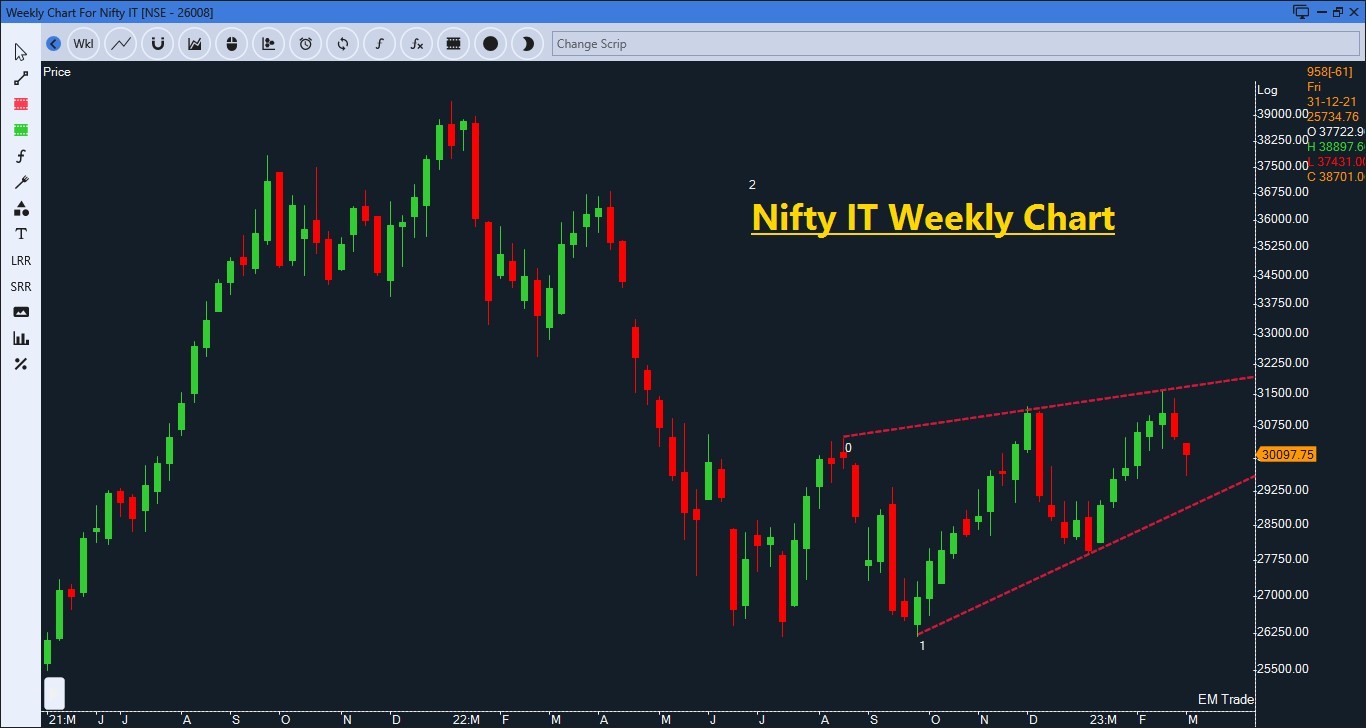
On the weekly Chart, the IT index is rising in a contracting rising channel. Index has formed a bearish engulfing pattern at the upper band of the rising channel.
Based on the above data and charts, it points to more time-wise correction for the IT index in the year 2023, but one can look for an accumulation in the later part of the year 2023 or 26000 to 27000 levels.


