

Stock: Reliance Industries
Sector: Oil Gas -Retail – Telecom
Reliance is an index heavy weight in Nifty.It has a weightage of 11.70%. For the last six months nifty has moved up by 10.52% and Reliance has underperformed in this period and has shown a return of only 1.32%. The six month period is from May 2022 closing price.
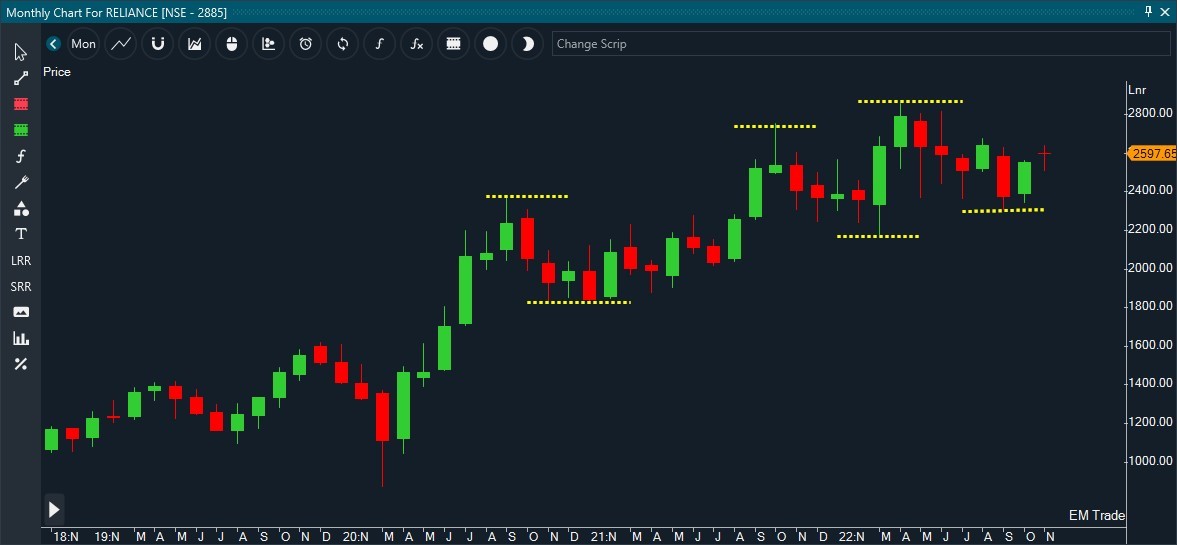
Monthly Chart:

Since the covid panic low of 882, the stock is in an uptrend exhibiting a sequence of higher lows and higher highs. This suggests that the prices are in a confirmed uptrend. Short term corrections are corrective retracement and halt above the monthly low. Short-term corrective decline around monthly low are buying opportunities.
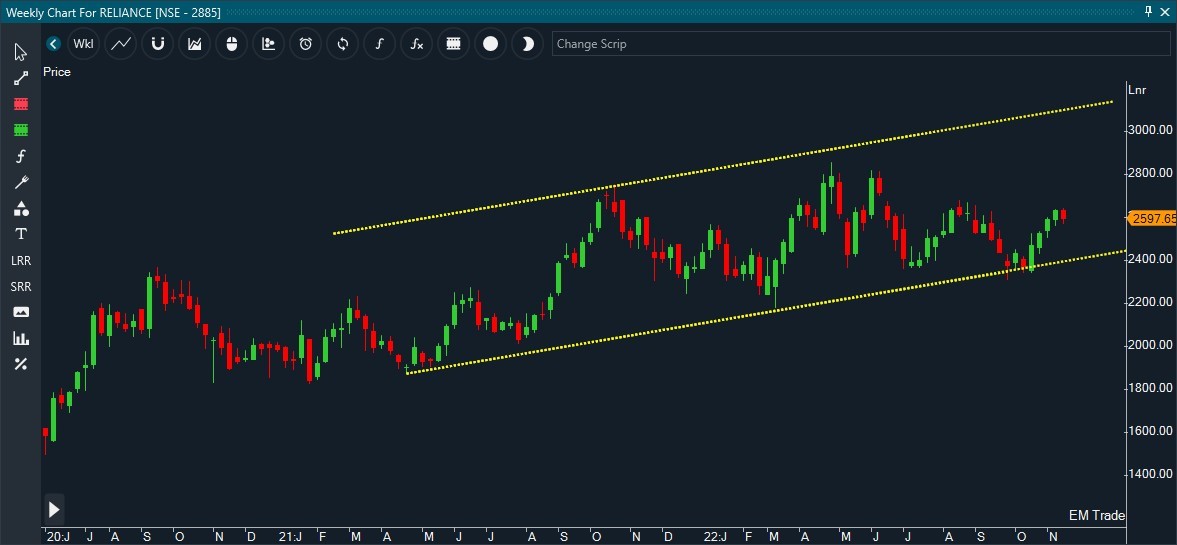
Weekly Chart :

On the weekly chart prices are moving in an upward-sloping channel. Prices have successfully tested the lower end of the channel and are trending up. The projection at the upper end of the channel is around 3000 levels.
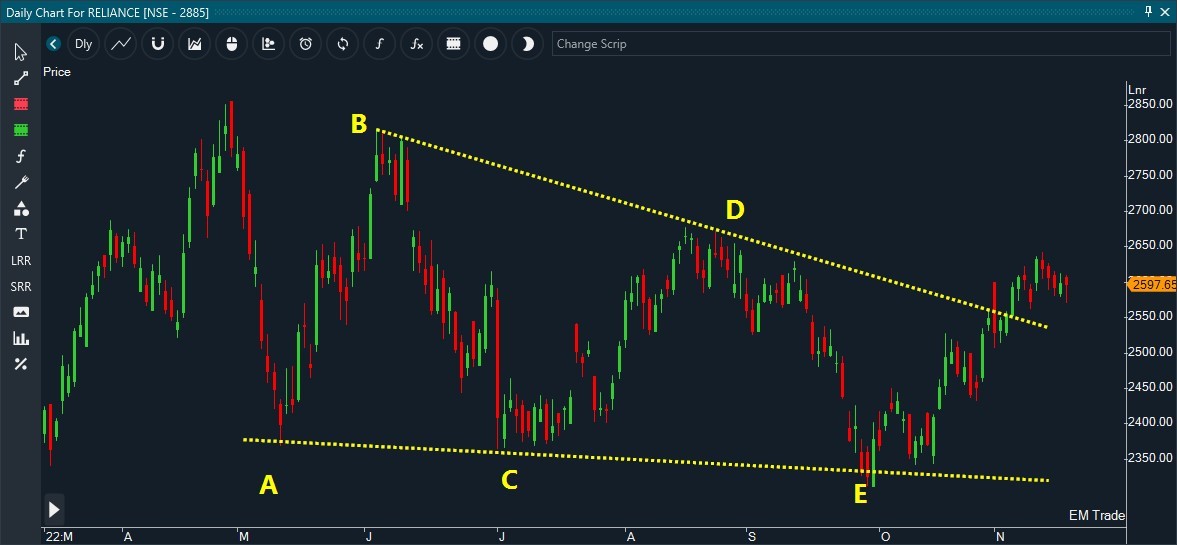
Daily Chart:

The chart pattern on the daily chart is a falling wedge and the stock has seen a bullish breakout from the falling wedge at 2553.The falling wedge pattern was completed as marked on chart A-B-C-D-E leg with throw under in E leg. There is harmony between monthly , weekly and daily chart, indicating bullish continuation sign.
+91 8010033033 | info@finlearnacademy.com | Request Callback
Confused what course / style is best suited to you? Unsure whether the course is worth your time?
Hop in and out of sessions for the week to find your groove, and pay the remainder amount of whichever course you prefer OR BOTH (We’re sure you’ll continue!!)
Email ID
Info@finlearnacademy.com
Mobile No.
+91 99300 41883

