Technical case study: BOSCH
The broader market is consolidating in the range of 18200 to 17700 but some sectors are showing strength. With strength analysis, we can understand outperforming and underperforming Sectors and Stocks.
Strength Analysis

The above data indicates, Auto and industrial manufacturing sector has the highest amount of frequency entering in different time scales. It shows strength in the highlighted sector.
Let’s deep down the quest to see which sub-sectors are performing within Auto mobile Stocks.
| Auto Sub Sector | No. Stocks | 01.12.22 (18812) to 17.02.23 (17944) -5% |
| Auto – 2 & 3 Wheelers | 3 | -0.51% |
| Auto – Cars & Jeeps | 2 | 1.02% |
| Auto – LCVs/HCVs | 3 | -1.31% |
| Auto – Tractors | 1 | -10.93% |
| Auto Ancl – Batteries | 2 | -5.15% |
| Auto Ancl – Electrical | 1 | -7.42% |
| Auto Ancl – Engine Parts | 2 | 7.22% |
| Auto Ancl – Others | 1 | -10.54% |
| Auto Ancl – Susp. & Braking – Others | 1 | 8.06% |
| Cycles & Accessories | 1 | -14.07% |
| Forgings | 1 | -0.11% |
| Tyres & Tubes | 4 | -5.24% |
Within auto space, Auto ancillary brake and Engine parts are doing well.
So, which are the stocks within Auto ancillary – Engine parts…

All the Auto ancillary stocks doing well as the broader market is down by near to -5% whereas stocks are near to upper single-digit return.
How Auto Sector looks technically…
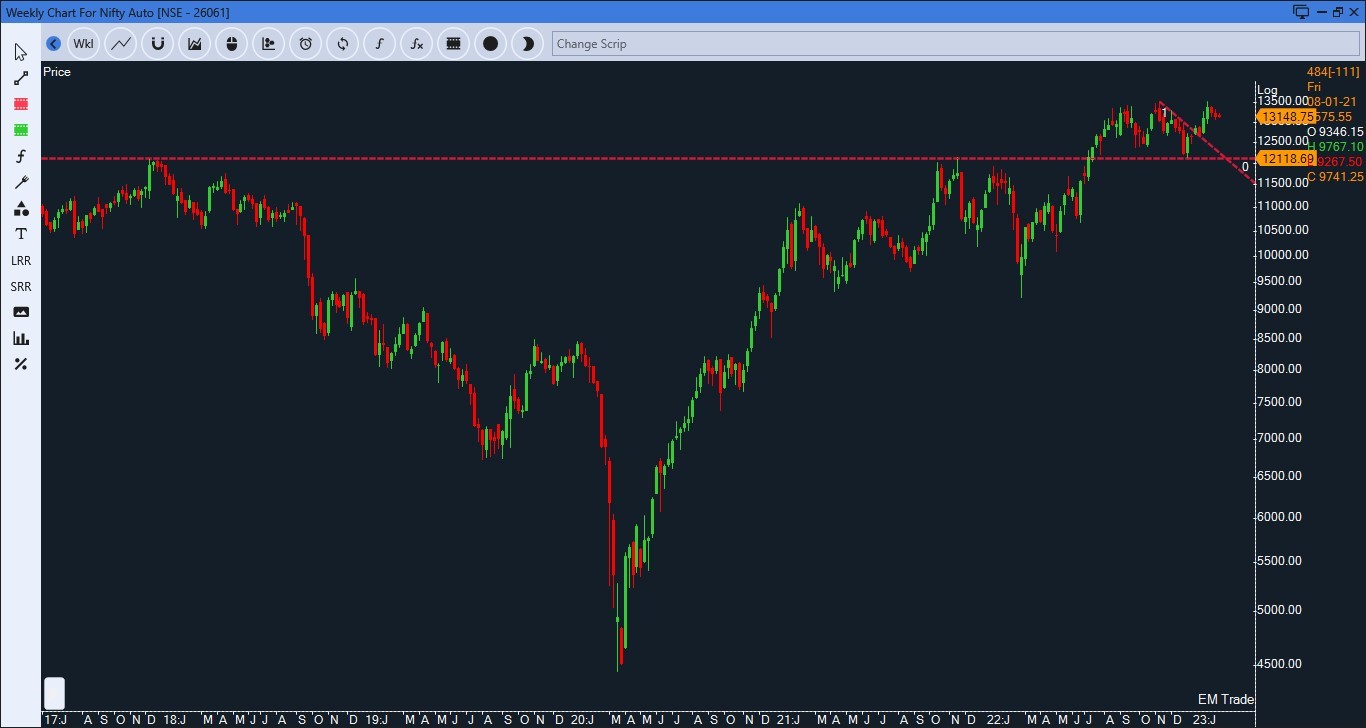
Nifty Auto Weekly Chart

Index has retested 4.5 years breakout level followed by resumption of upside movement. It is bullish continuation sign.
Let’s have look at some interesting technical development in Bosch Ltd
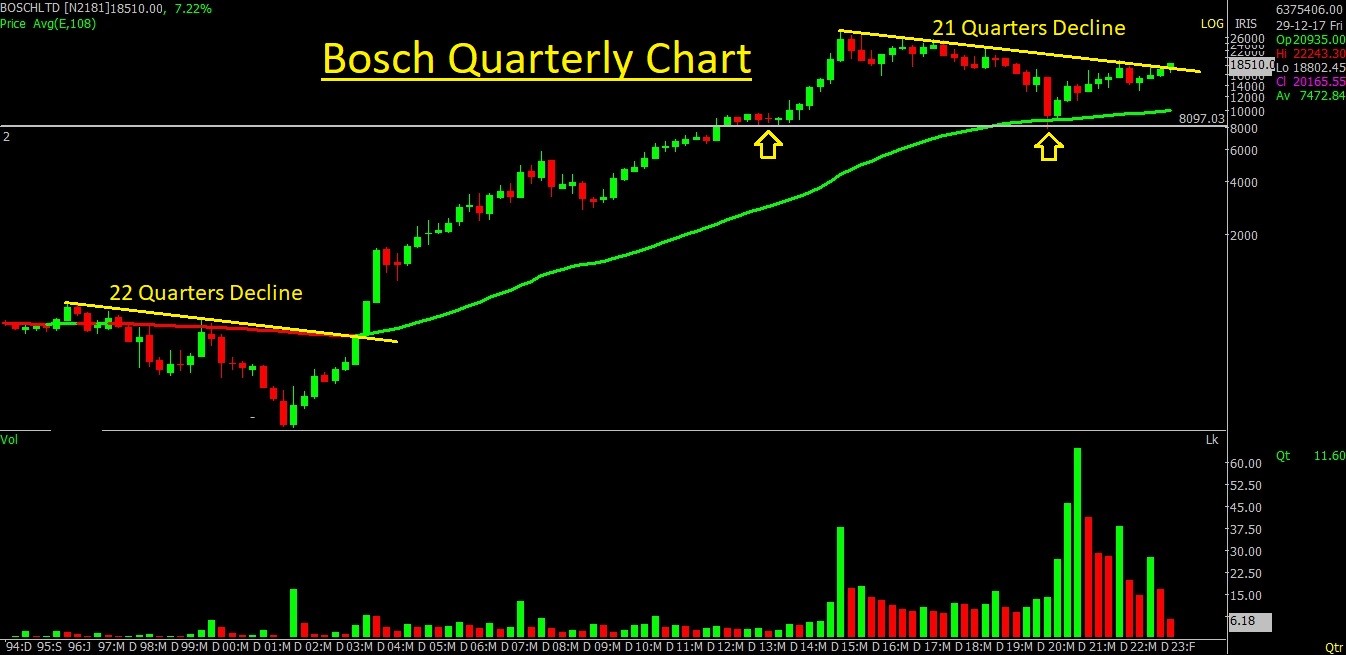
Bosch Ltd Quarterly Chart

On the quarterly chart, it can be observed, Stock has the same time-wise correction i.e. around 22 Quarters. Recent declining move halted at long-term moving average support. It coincides with the horizontal support line. Stock is on the edge of a breakout from 95 months falling trend line. It is a strong price structure on a higher time frame.
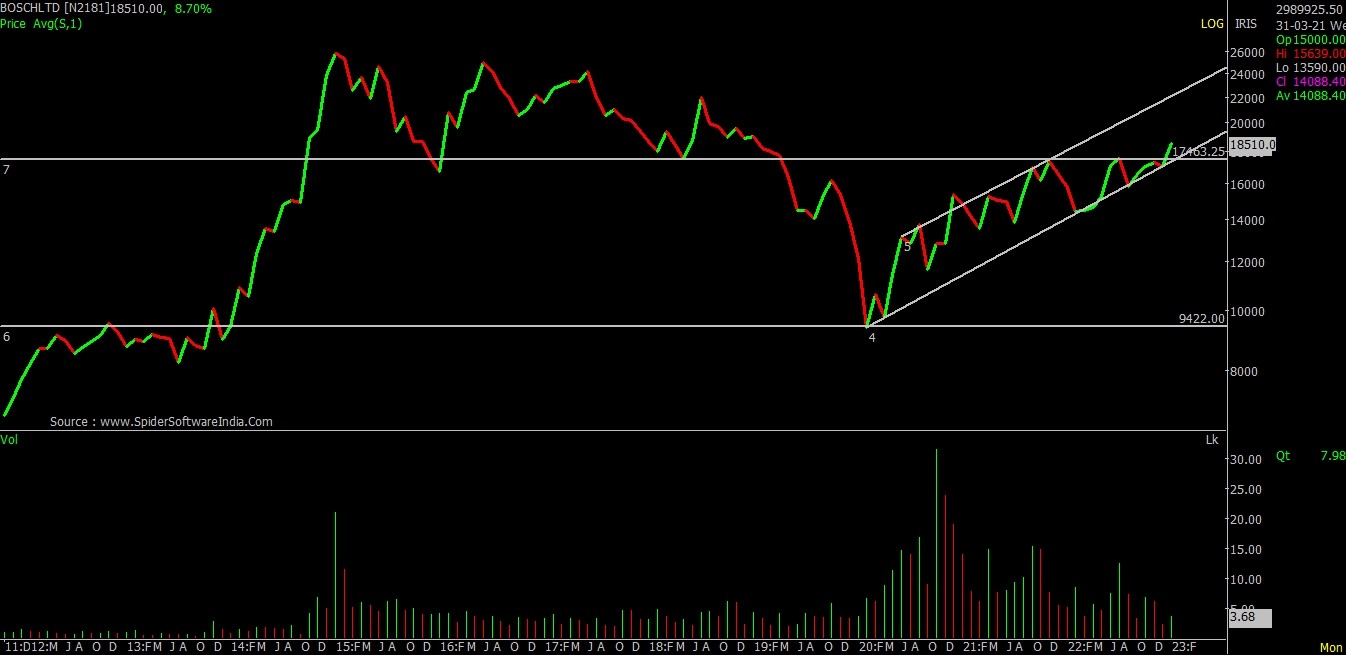
Bosch Monthly Chart

Stock is moving in an upward-sloping channel. Recently stock took support at the lower arm of the rising channel followed by a breakout above the immediate hurdle.
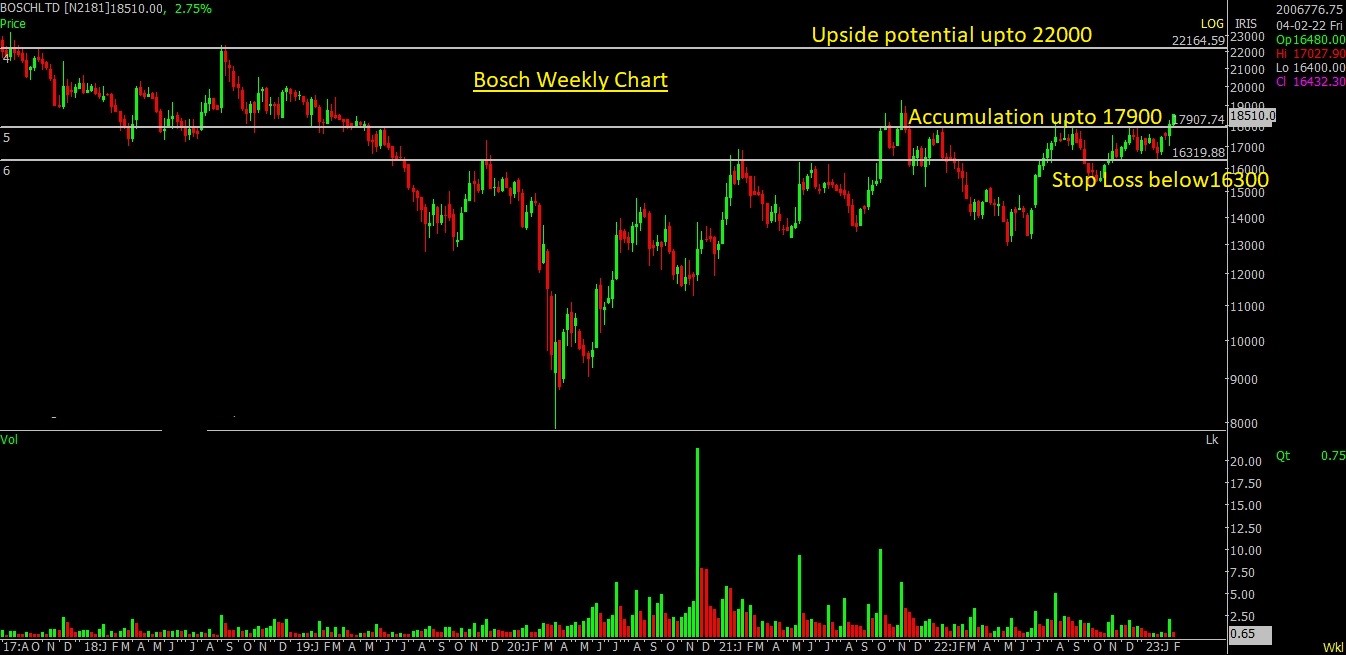
Bosch weekly Chart

So far, we looked at the Sector, sub-sector and the stock’s price structure on a higher time frame. It sets a positive tone. Let’s see, trade initiating level. We made accumulation range from the current level to the breakout level. Stop loss at the lower band of consolidation patch i.e. 16300 and upside potential at immediate resistance of 22000.


