Technical Case Study: MARUTI
This case study includes a thought process from identifying the index’s strength and stocks and checking technical development in the chart.
Here we have worked on the Auto sector and Maruti stock.
Strength Analysis

After a strong performance in metal and Oil and gas, the automobile is emerging in the top 5 list. The automobile sector is down by -3% in comparison to a -6% decline in the broader market. In the previous week, Auto mobile was a lead performer with a gain of 1.5% whereas the broader market was down by -2.35%.
Auto Sub-Sector Analysis
|
Auto Sub Sector |
Average of 01.12.22 (18812) to 27.01.23 (17604) -6% | Average of 23 to 27 Jan (-2.35%) |
|
Auto – 2 & 3 Wheelers |
0.51% |
6.05 |
|
Auto – Cars & Jeeps |
-0.20% |
1.97 |
|
Auto – LCVs/HCVs |
-1.89% |
4.94 |
|
Auto – Tractors |
-14.34% |
-4.04 |
|
Auto Ancl – Batteries |
-6.47% |
-0.435 |
|
Auto Ancl – Electrical |
-10.18% |
-2.41 |
|
Auto Ancl – Engine Parts |
3.58% |
-0.41 |
|
Auto Ancl – Others |
-2.68% |
4.1 |
|
Auto Ancl – Susp. & Braking – Others |
-5.17% |
-0.27 |
|
Cycles & Accessories |
-5.41% |
1.18 |
|
Forgings |
-2.50% |
10.7 |
| Tyres & Tubes | -5.61% |
-2.8225 |
Within the auto sector, 2& 3-wheelers have strong performance but it was influenced by Bajaj auto. Cars and Jeeps have also done well vis a vis to a broader market and peer sub-sector.
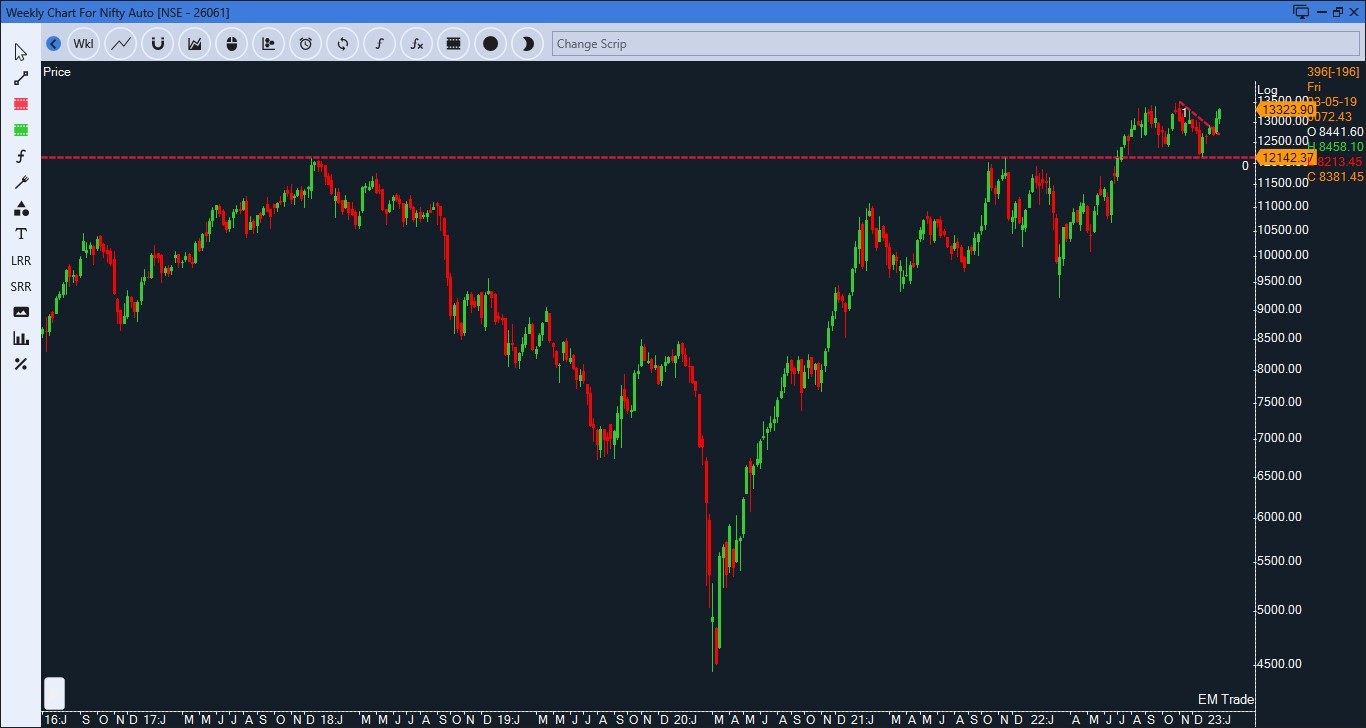
Nifty Auto Weekly Chart

Auto Index has given long-term horizontal breakout followed by retest at role reversal level. The index has given a breakout from a tiny trendline which indicates bullish momentum in the index.
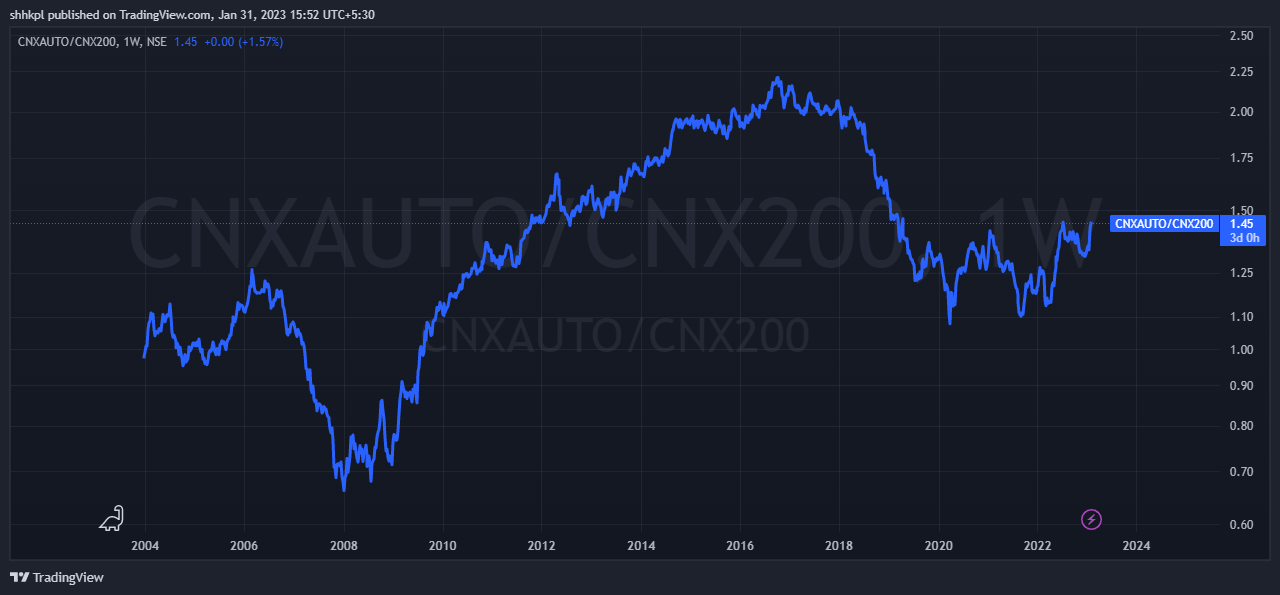
Nifty Auto / Nifty 200 Weekly ratio chart

After an underperformance of Auto stock for a long time, they have formed the base followed by an upward move. It shows the better relative strength of the auto sector.
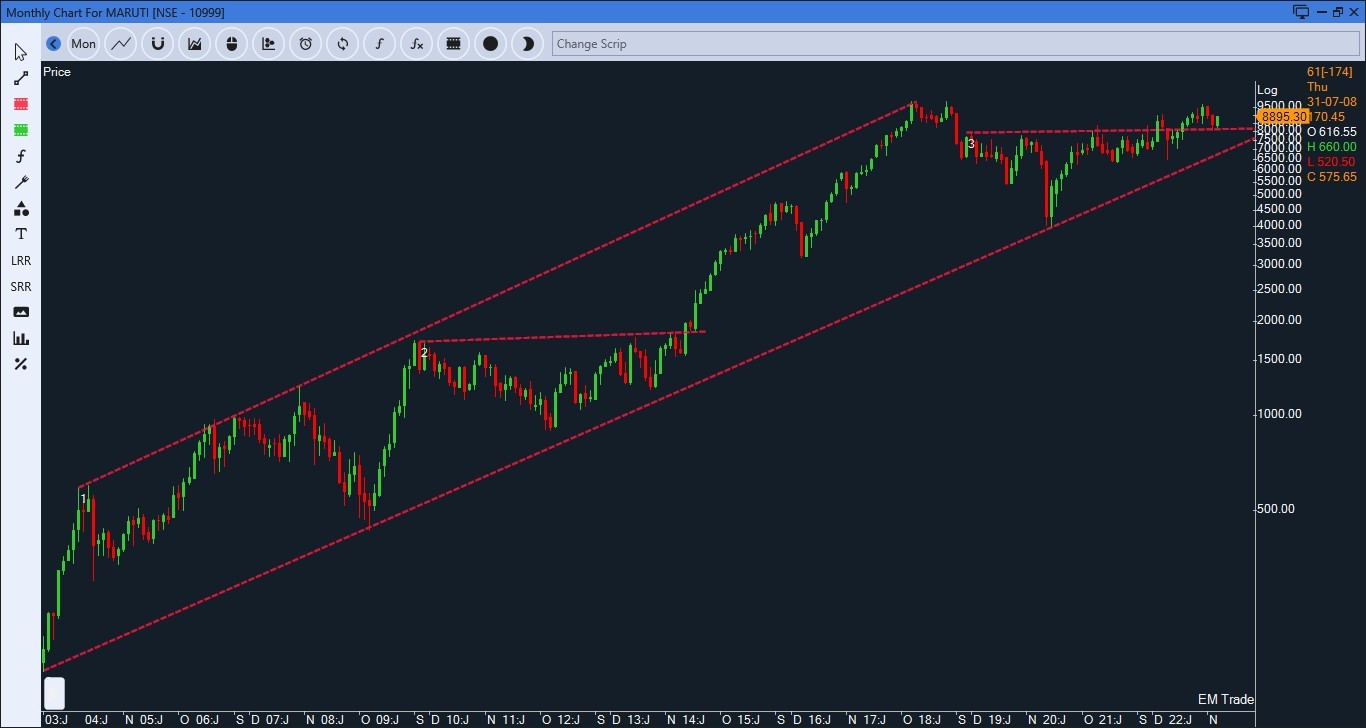
Maruti Monthly Chart

For the past 20 years, Stock is trading in a rising channel. In between, the stock has consolidated for 4 to 5 years followed by a strong breakout
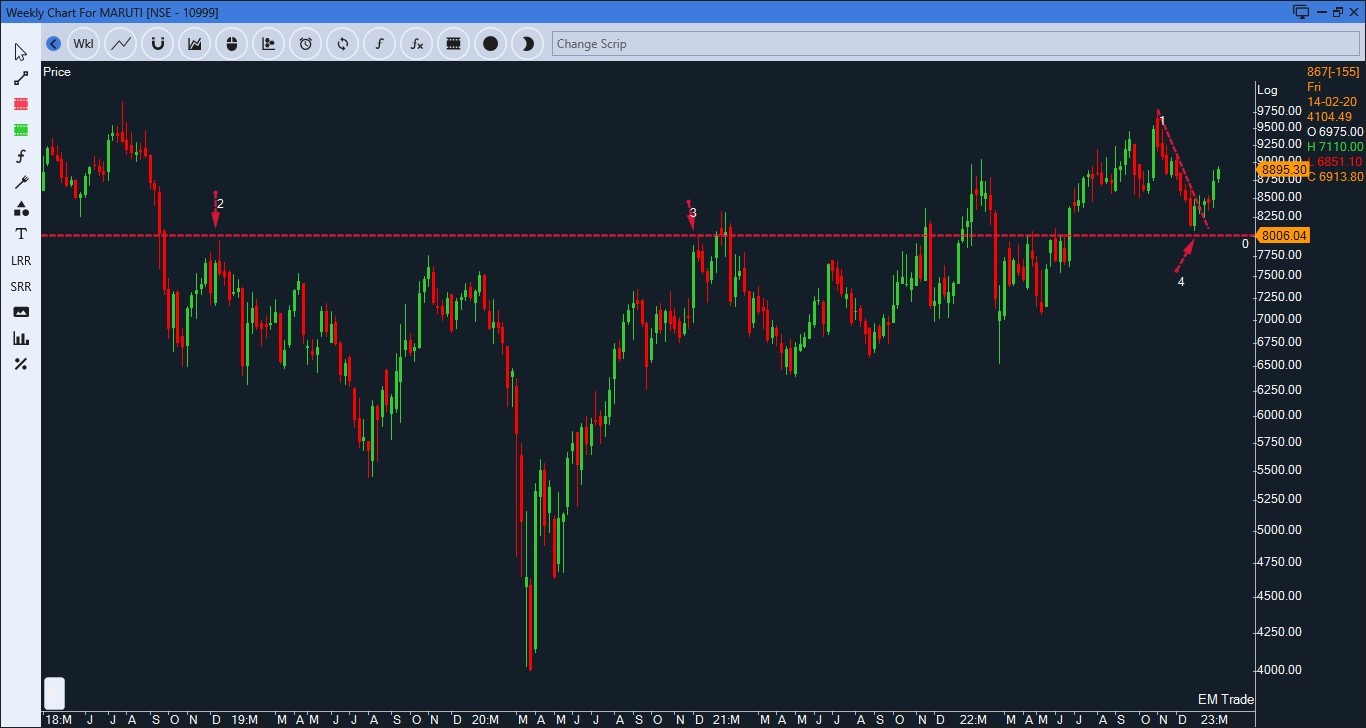
Maruti Weekly Chart

The stock has retested the breakout level which is known as the role reversal level. It has given a breakout from the falling trendline indicating the presence of bulls.
Based on the above setup, Stocks look strong in the 8900 to 8600 range. The positive view will get negated below the 8300 level.
The note is for an educational perspective.


