
Technical case study: BALKRISIND
About Nifty Auto Index: The Nifty Auto Index is designed to reflect the behaviour and performance of the Indian automobile sector. The Nifty Auto Index is computed using the free float market capitalization method with a base date of January 1, 2004 indexed to a base value of 1000.
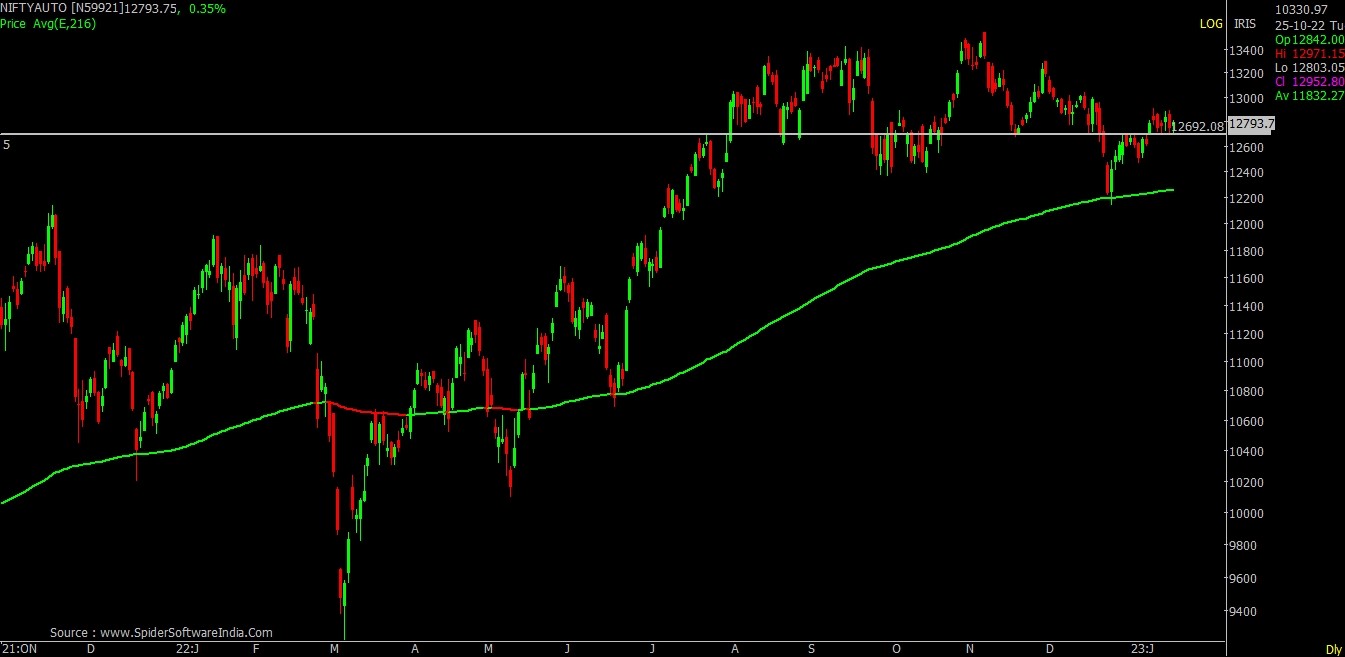
Auto Index has taken as support at long-term moving average and started to form higher high and higher low sequence. The index is at the lower band of consolidation, offering a favourable risk-reward ratio.
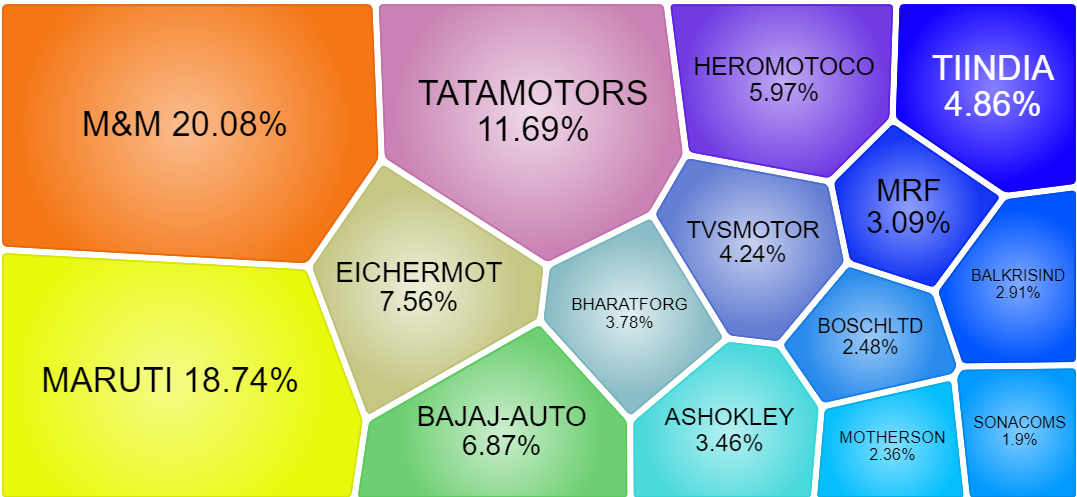
Auto Sector Component
Nifty Auto/Nifty 200 Ratio Chart
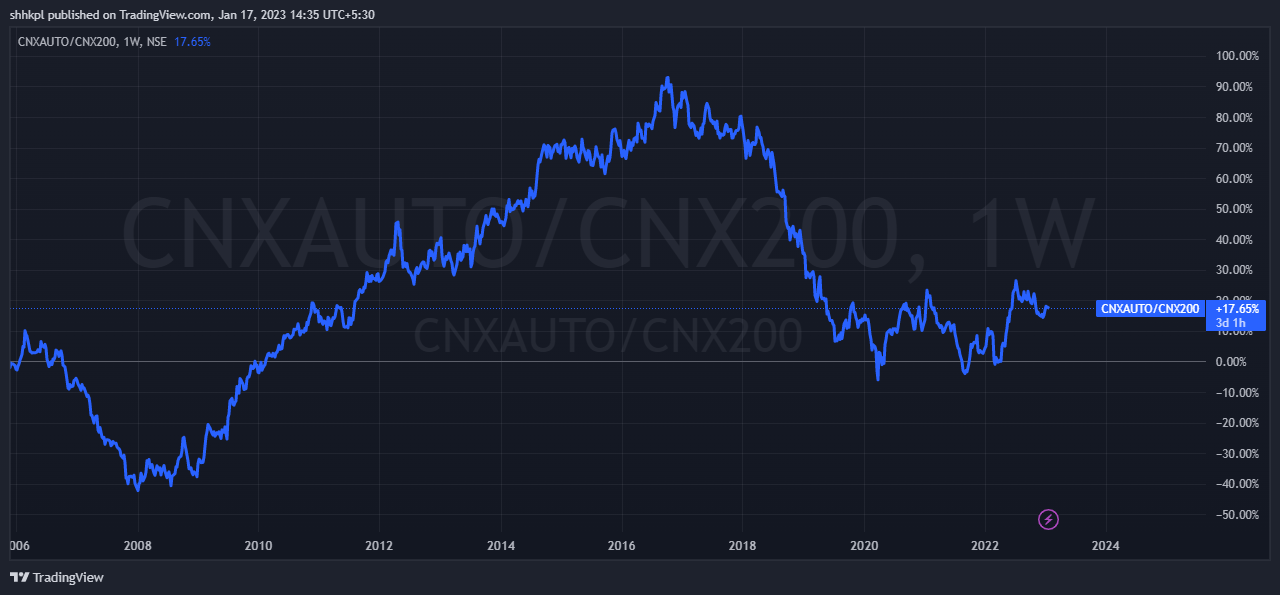
After the underperformance, the ratio chart has made a base which shows the equilibrium between demand and supply. The ratio chart has started to pick movement on the higher side indicating strength in the auto sector.
Price performance of Auto Sub Sector
| Sub Sector | Average of 01.12.22 (18812) to 13.01.23 (17956) -5% |
| Auto – 2 & 3 Wheelers | -4% |
| Auto – Cars & Jeeps | -1% |
| Auto – LCVs/HCVs | -5% |
| Auto – Tractors | -10% |
| Auto Ancl – Batteries | -7% |
| Auto Ancl – Electrical | -5% |
| Auto Ancl – Engine Parts | 4% |
| Auto Ancl – Others | -8% |
| Auto Ancl – Susp. & Braking – Others | -3% |
| Cycles & Accessories | -6% |
| Forgings | -8% |
| Tyres & Tubes | -1% |
Inferring from the table indicates strong price performance in Auto engine parts followed by tyres and cars & jeeps stocks.
Auto Stock price performance
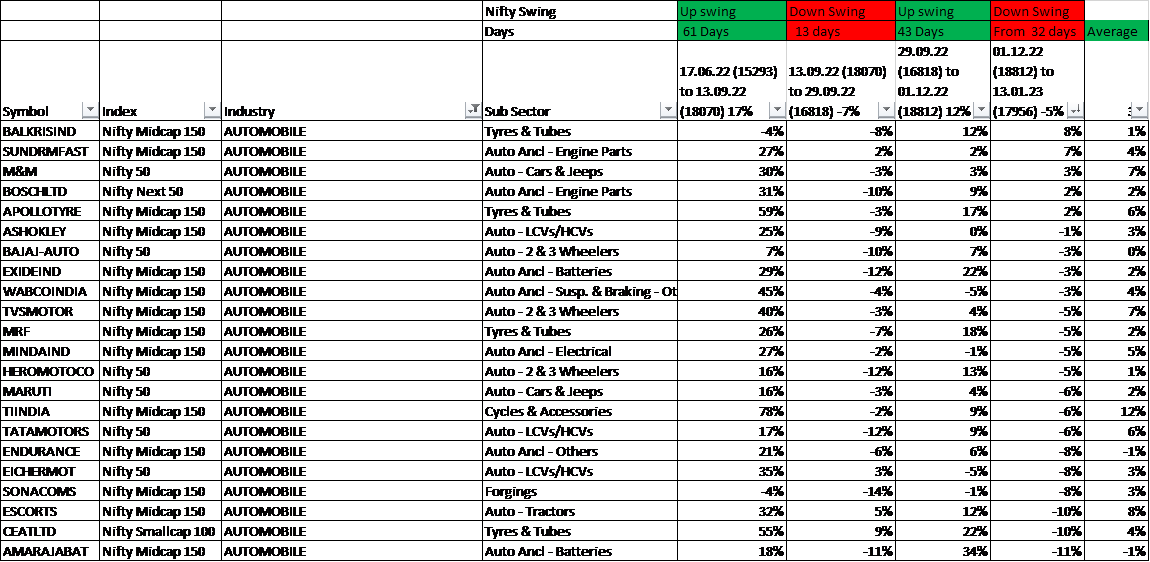
BALKRISIND and SUNDARMFAST stock is leading the pack. Mentioned stocks belong to the leading sub-sector as well.
BALKRISIND: Intensity of Fall
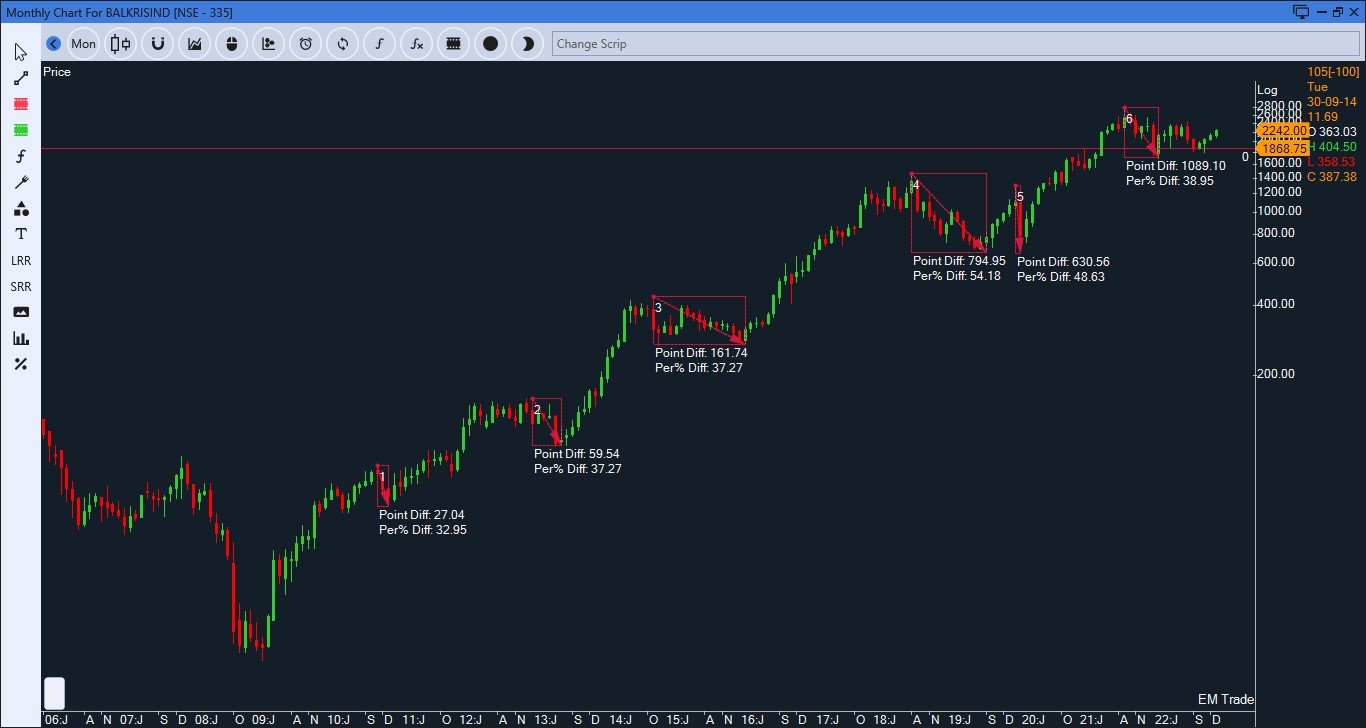
Since the year 2009, Stock has major fall 6 times. 4 out of 6 times stock has fallen by near to 35% followed by upside movement. 2 out of 6 times falls were around 50%. The recent decline is around 38% followed by upside movement.
BALKRISIND Monthly Chart: Moving Average
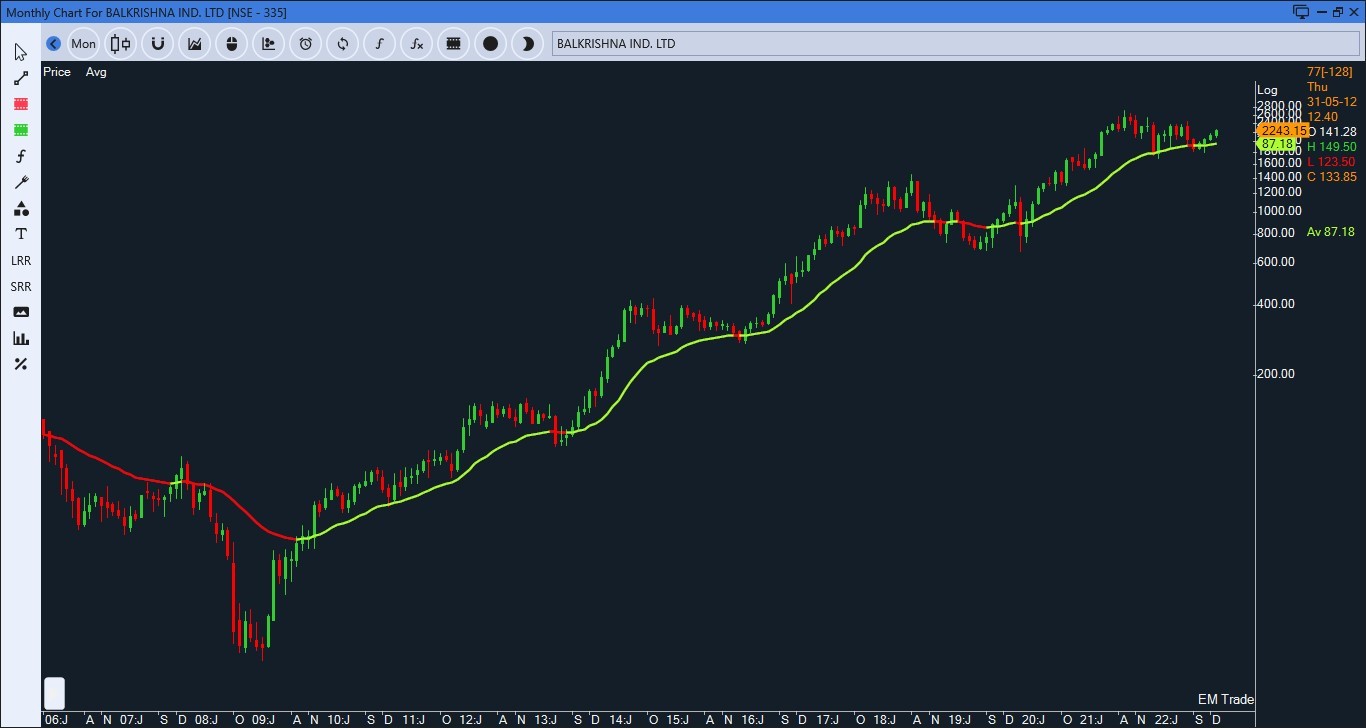
For more than a decade, the stock is taking support at the moving average. The recent decline move intersected with a slope of the moving average followed by the upside movement. It is a bullish continuation sign.
BALKRISIND Daily Chart: Price Action
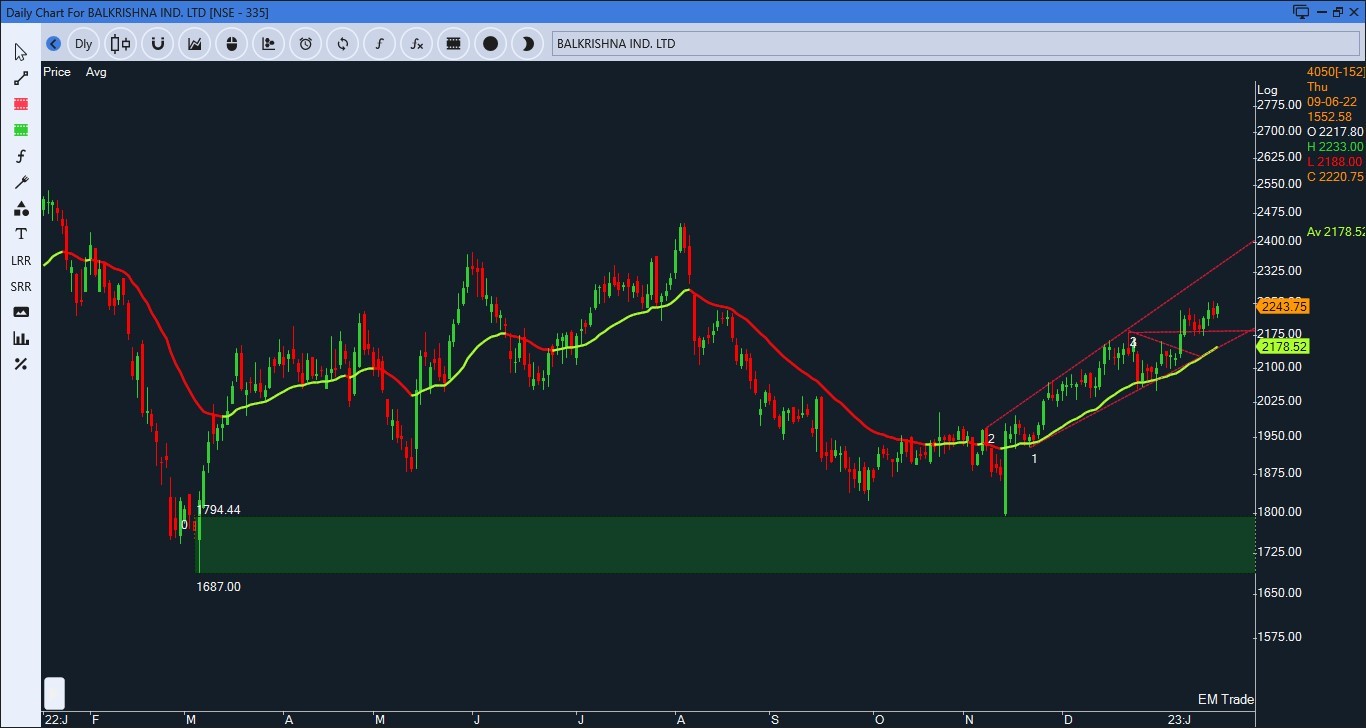
The stock has reacted from the support band and taking support at the moving average. It is rising in an upward channel with an intermediate breakout on the higher side.
BALKRISIND Daily Chart: Risk to reward set up
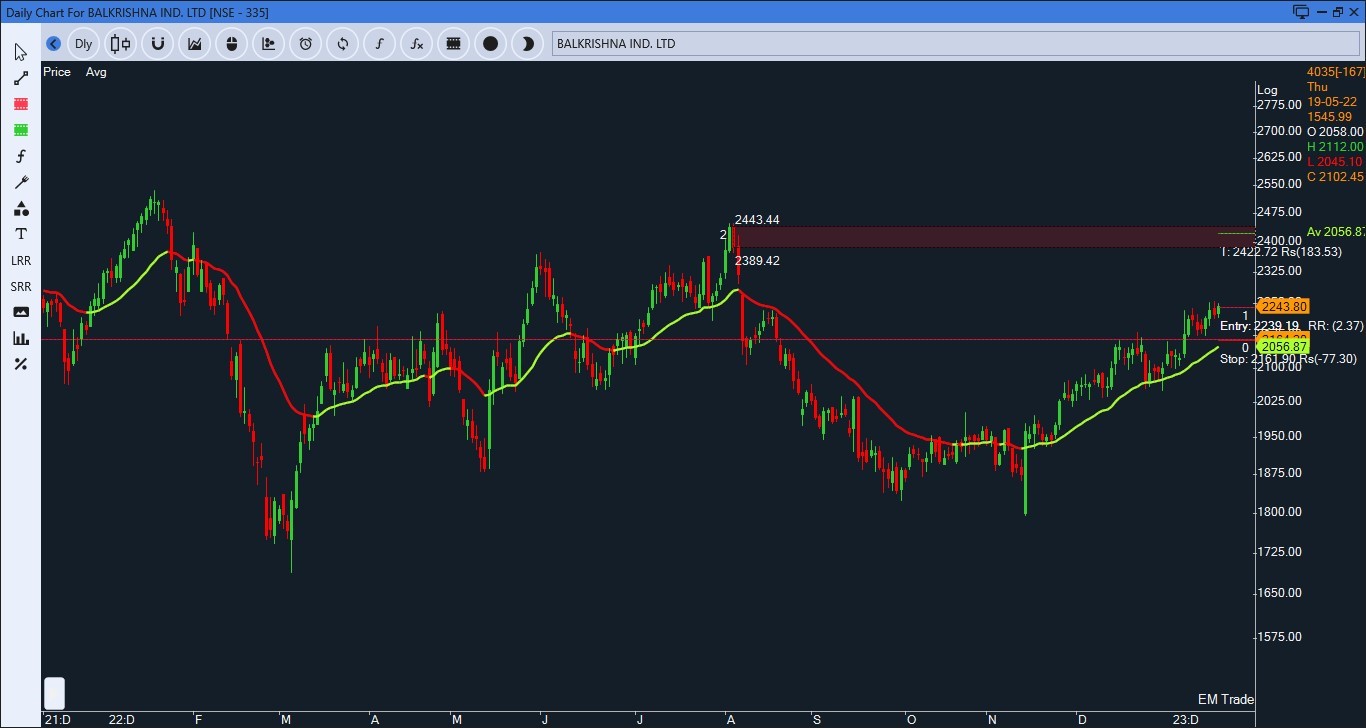
As the stock is in upside movement, the Current level can be considered as a buying opportunity with a stop loss below support i.e. 2160 on a closing basis and 2420 as the target as it is an immediate resistance band.
This case study is from an accumulation perspective.


