
Technical case study: GSPL
Forward Looking Case Study
Stock: GSPL
Sector: Oil and Gas
Key Learning:
Strength Analysis
Top Down Approach
Stock Selection
Multiple Time frame analysis
About Oil and Gas Sector:
The Nifty Oil & Gas Index is designed to reflect the performance of the stocks belonging to Oil, Gas and Petroleum industry. The Nifty Oil & Gas Index comprises of maximum of 15 stocks that are listed on the National Stock Exchange.
Data 1: Strength Analysis
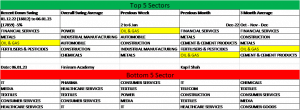
Strength analysis note help us to identify the strong and weak sector. We can compare the strength of sector with broader market and other sector.
One can find detail report on https://finlearnacademy.com/resource/ and explanatory video https://www.youtube.com/watch?v=Ho3ED79VrMM&t=4s
Based on summery of strength analysis, Sectors like Oil and gas, Financial services and metal has multiple occurrence in top 5 list. It indicates positive sector where buying opportunity can be looked for.
Nifty Oil & Gas Sector
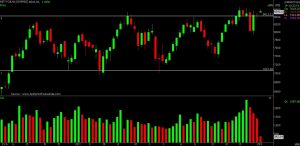
Oil and gas sector has brief history but it has formed long consolidation patch followed by upside breakout. Technically, it indicates bullish continuation sign.
Stock performance
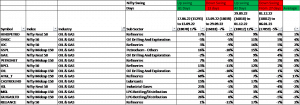
Above data indicates, how stock has performed in different swings of market. In recent decline of 5%, majority of stocks fallen less that broader market. It indicates internal strength of market. At this point, midcap stocks are doing well. So, GSPL is the stock which belongs to midcap category and chart in top 5 stocks.
Let’s learn more about GSPL
About GSPL: Gujarat State Petronet Limited is a Public Limited Company incorporated under The Companies Act,1956. Further it is a Government Company u/s 2(45) under the Companies Act,2013.
Gujarat State Petronet Limited alongwith its subsidiaries is primarily engaged in transmission of Natural gas through pipeline. Further it is engaged in business of implementing and operating City Gas Distribution and generation of electricity through windmills.
GSPL Monthly Chart
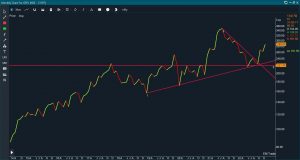
After a decent decline near to 35%, Stock took support at role reversal level. It coincides with slope of rising trend line. After corrective decline move, Stock has started to form higher high and higher low sequence which is positive development.
GSPL Daily Chart
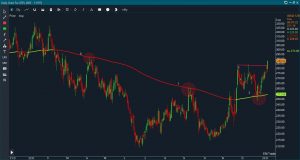
Stock took support at long term moving average followed by breakout on higher side. It indicates good technical structure and momentum in the stock. Stock can have normal oscillation in the range of 288 to 280. Positive structure of stock will get negated below 268 level. On higher side, Stock has hurdle around 330 level.


