10 stocks to track amid 20,000+ layoffs
07Jan, 2023
FinLearn Academy
Calls for the week:
- The strategy we will be implementing today is a combination of EMA ( exponential) + SMA(Simple) Moving average
- A simple moving average is an average of prices over time, while an exponential moving average (EMA) gives more weight to the most recent data.
- Moving averages give the trader a sense of whether the trend is going up or down while also identifying potential areas of support or resistance..
- However, there are some differences between the two measures. The main difference between EMA and SMA is the sensitivity of each to changes in the data used in its calculation. The SMA calculates the average of the price data, while the EMA gives more weight to the current data. More recent price data will have a greater impact on moving averages, while older price data has less impact.
EMA ( exponential) + SMA(Simple) Positive Crossover
- EMAs place a higher weighting on recent data than on older data, they are more reactive to the latest price changes than SMAs
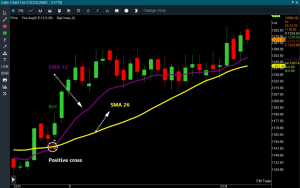
- When shorter time period average (12 EMA ) cuts the larger time period average (26 SMA) from below is bullish crossover
- Let’s look at an example in the chart below ( on ICICI Lombard General Insurance a daily time frame)

A buy signal is generated when the two moving average cross each other Now that you know what an EMA + SMA Positive crossover is, let’s look at a few opportunities in the LIVE market:
| Time | Scrip Name | Signal | Entry Rate |
| 24-11-2022 | INDUSINDBK | BUY | 1175.55 |
| 13-12-2022 | DIVISLAB | BUY | 3355.55 |
| 30-11-2022 | AXIS BANK | BUY | 901.25 |
| 28-10-2022 | JSWSTEEL | BUY | 670.4 |
| 29-11-2022 | ICICIGI | BUY | 1175 |
EMA ( exponential) + SMA(Simple) Negative Crossover
- An exponential moving average (EMA) is similar to a simple moving average (SMA), which measures the direction of a trend over a period of time. However, while the SMA only calculates the average of the price data, the EMA applies more weight to more current data. Due to its unique calculation, the EMA will follow the price more closely than the corresponding SMA.
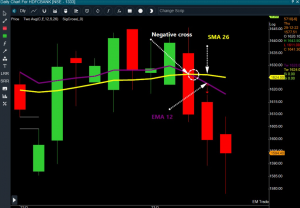
- When the higher time period average (26 SMA) crosses the lower time period average (12 EMA) from above is bearish crossover
- Let’s look at an example in the chart below ( on HDFC Bank a daily time frame)

- Now that you know what an EMA + SMA a Negative crossover is, let’s look at a few opportunities in the LIVE market
| Time | Scrip Name | Signal | Entry Rate |
| 22-11-2022 | MARUTI | SELL | 8873.75 |
| 08-12-2022 | TATAMOTORS | SELL | 417.2 |
| 26-12-2022 | TATACONSUM | SELL | 775.3 |
| 05-01-2023 | HDFCBANK | SELL | 1599.7 |
| 26-12-2022 | CIPLA | SELL | 1096 |
Awesome, but what’s my takeaway?
- Indusbank, divi lab, axis bank, jsw steel & ICICIGI have given a buy call on a daily time frame (implementing EMA + SMA Positive crossover )
- Maruti, tata motors, tataconsum, Hdfc bank & Cipla have given a sell call on a daily time frame (implementing ema +sma Negative Crossover)


