
Case Study: Abbot India
Technical case on ABBOTT INDIA
Nifty Pharma Weekly Chart
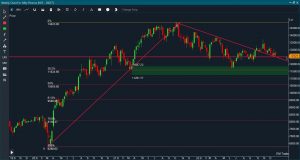
In recent times, Pharma sector is underperforming sector. Technically, Index retraced to the support band and 38.2% retracement level. The index formed a piercing line candle pattern indicating the bull’s presence at the support level. The index breached falling trendline but was not able to pick up the momentum. So technically structure is good but lacks strength.
Nifty Pharma/ Nifty 200 Ratio Chart
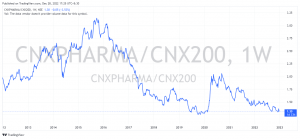
A lack of strength can be seen by the falling ratio line. The current ratio line reading is at the previous turning point but it is still under pressure.
Sector-wise performance
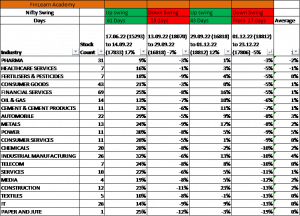
Pharma sector has been scored from the bottom but in the recent decline, it fell lesser than the broader market but is not a great sign of structural change.
Looking at stock-specific development
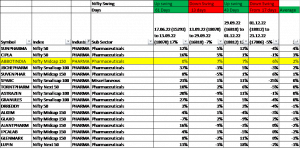
In the underperforming pharma sector, there are some stocks like sunpharma, Cipla, and Abbotindia doing well. Abbotindia started to do well in recent fall as the index was down by -5% whereas the stock is up by 6%.
Let’s check its relative strength
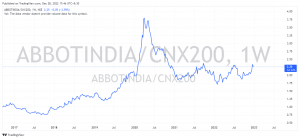
Looking at stock viz a viz to Nifty 200, after underperformance, stock has started to pick up its movement. Moving above the immediate hurdle can be considered as a bullish continuation sign.
Stock vs Pharma sector
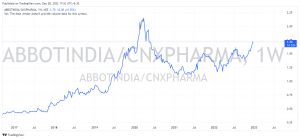
Stock has started to outperform pharma index after forming a strong base. Its shows the stock’s relative strength in comparison to the index.
Peer price performance
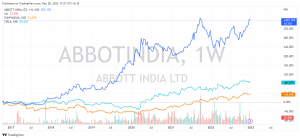
Among the three leading stocks, Abbott India has strong outperformance.
Stock Technical chart
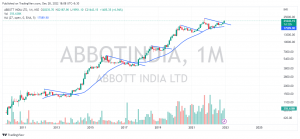
For more than a decade, Stock is taking support at a moving average followed by a breach of falling trendline. It is a bullish continuation sign.


