Technical Case Study: METROPOLIS
About Health care Index:
The Nifty Healthcare Index is designed to reflect the behaviour and performance of Healthcare companies. The Nifty Healthcare Index comprises a maximum of 20 tradable, exchange-listed companies.
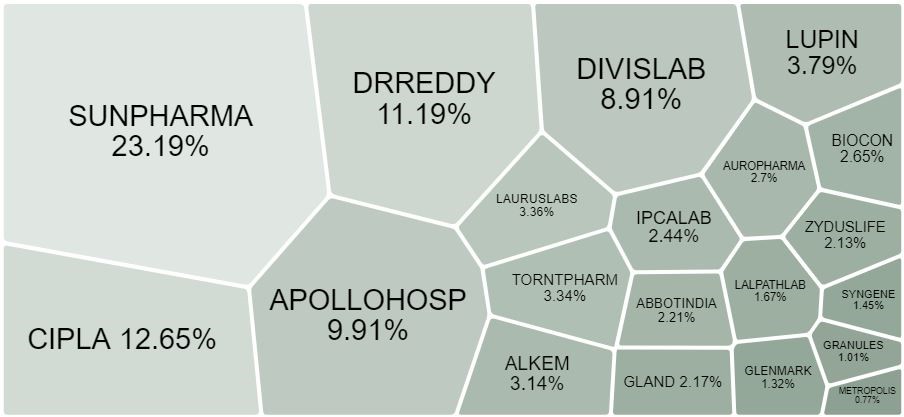
Components of Healthcare Index:
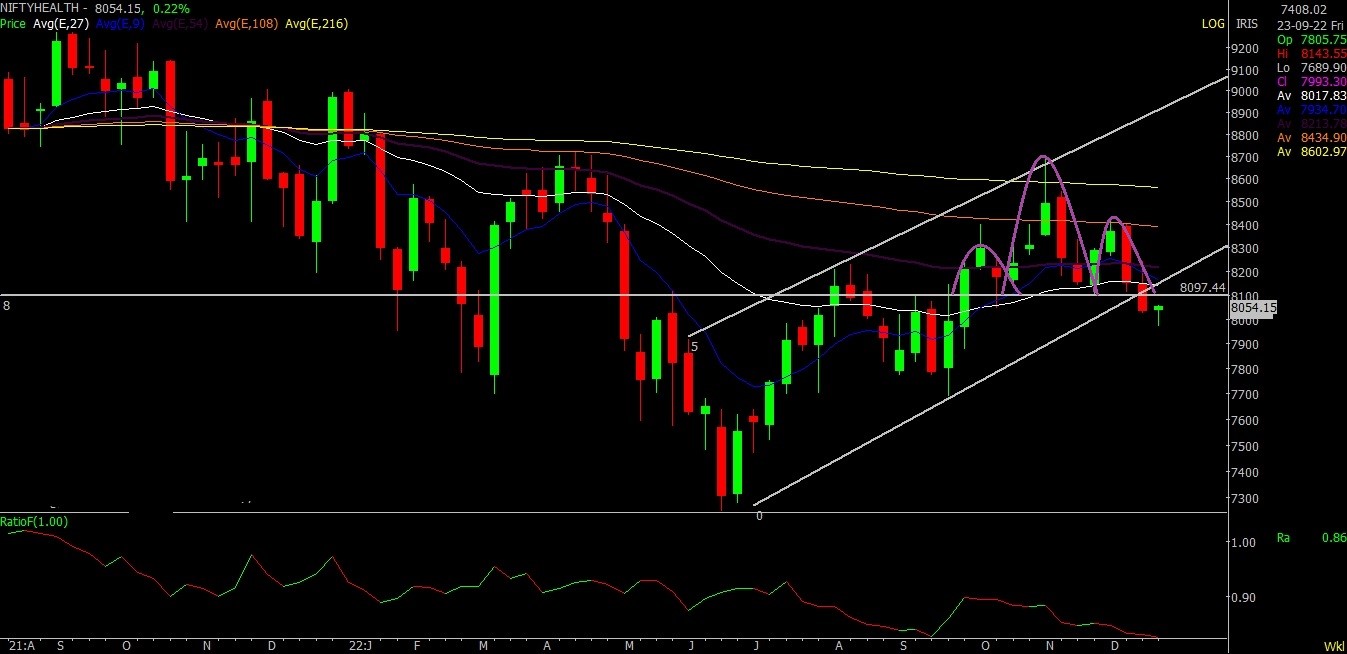
Technical Chart: Healthcare Index

There are 4 technical developments on the weekly chart.
1. With the recent rise, the Index entered into a resistance band and formed a bearish engulfing pattern
2. Above mentioned zone coincides with downward sloping long-term moving average
3. Index has formed a Head and shoulder pattern with a neckline breakout, mentioned price pattern has a negative implication.
4. Index moved below the rising channel which is a bearish continuation sign.
Above technical formation harping on the same tune and echoes bearishness.
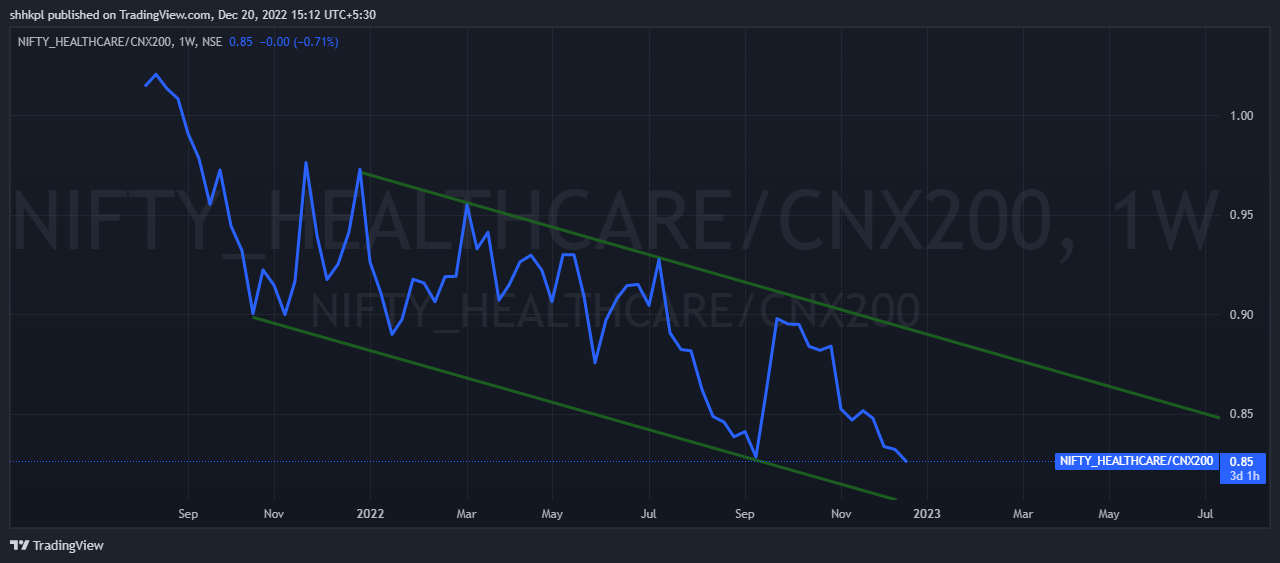
Nifty Healthcare/ Nifty 200 Ratio Chart

The falling ratio line indicates the huge underperformance of the healthcare index viz a viz to a broader market. It shows weakness in the sector.
Price Performance of Healthcare stocks
| The price performance of Healthcare Stocks | |||
| Name | 29.09.22 | 19.12.22 | % |
| LAURUSLABS | 509.45 | 385.15 | -24% |
| GLAND | 2087.85 | 1635.25 | -22% |
| METROPOLIS | 1538.1 | 1282.35 | -17% |
| AUROPHARMA | 509.7 | 438.6 | -14% |
| LALPATHLAB | 2591.4 | 2285.3 | -12% |
| DIVISLAB | 3693.65 | 3350.5 | -9% |
| BIOCON | 286.85 | 262 | -9% |
| ALKEM | 3259.85 | 3002.05 | -8% |
| IPCALAB | 909.4 | 873.05 | -4% |
| CIPLA | 1115.85 | 1090.35 | -2% |
| GRANULES | 324.3 | 323.05 | 0% |
| DRREDDY | 4360.7 | 4373.1 | 0% |
| TORNTPHARM | 1545.8 | 1577.25 | 2% |
| SYNGENE | 556.4 | 573.55 | 3% |
| APOLLOHOSP | 4391.7 | 4589.75 | 5% |
| GLENMARK | 387 | 409.1 | 6% |
| SUNPHARMA | 930.7 | 989.15 | 6% |
| ZYDUSLIFE | 382.85 | 411.65 | 8% |
| ABBOTINDIA | 19181.1 | 20864.9 | 9% |
| LUPIN | 654.8 | 726.7 | 11% |
Nifty recent bottom of 16900 on 29th Sep 2022 till 18400 on 19 Dec 2022 increased by 9%.
Looking at Healthcare stocks, 2 out of 20 stocks have outperformed the index. More than half of the component is under the red zone.
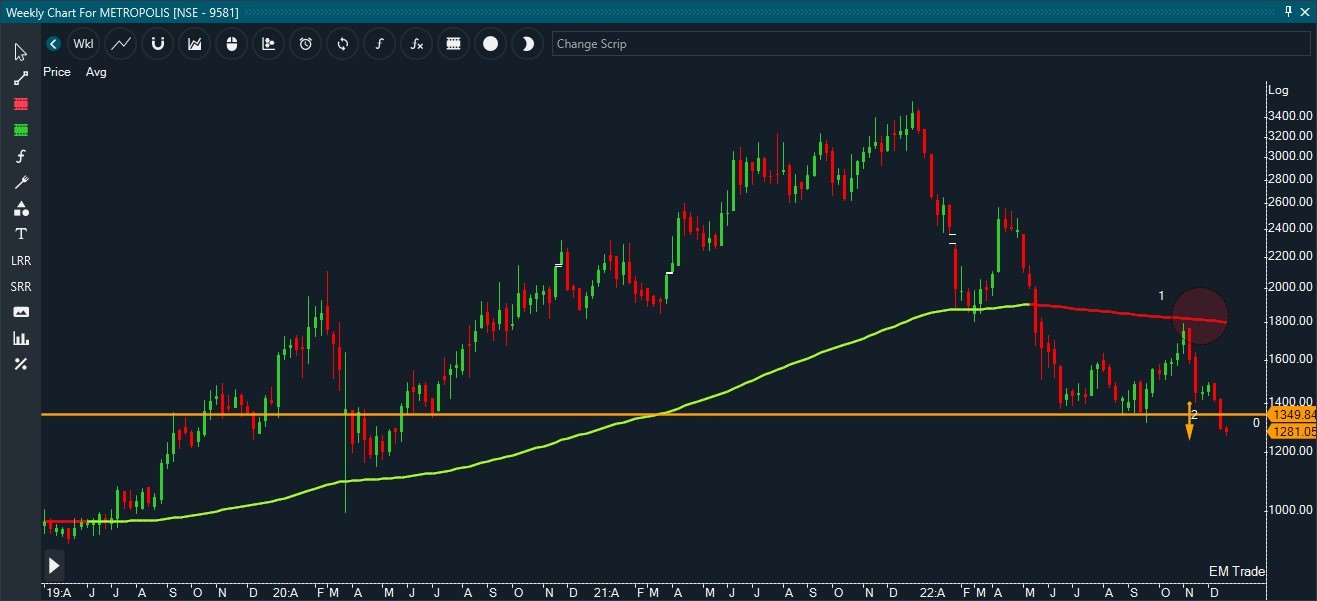
Stock specific Development: Metropolis

Stock is forming a lower high and lower low sequence. The intermediate rise is capped at the downward-sloping long-term moving average. Post resistance, the Stock has breached the support level which indicates a bearish continuation.
Previous


