Technical case study on Ultratech Cement
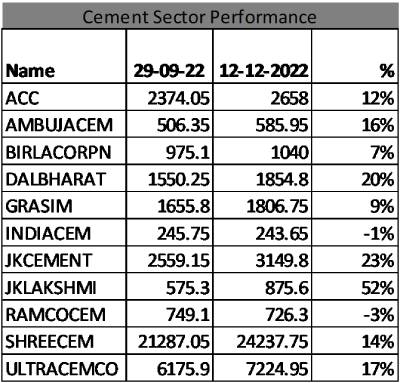
From the recent low of 16800 to current level 18600, Nifty improved by almost 11%. Sector like banks and metals has outperformed. Cement stocks moved in line with broader market.

Inferring from the table, leading cement stocks moved along with market. Many stocks took support at their earlier breakout level followed by upside movement.
Tech Fact: Ultratech Monthly Chart

In its strong upside move, stocks has major 3 declines in the range of 37% to 40%. Recent fall was in line with previous decline followed by upside movement.
Head and Shoulder Pattern on Weekly Chart

Stock has formed 40 week Inverted Head and Shoulder pattern followed by the neckline breakout. It is a bullish development.
Price Action on Weekly Chart

Stock has moved above falling trendline and move above horizontal line resistance level. Stock has retested the breakout level with presence of buyer.
Candle pattern on Daily Chart

On the retest of breakout level, Index has formed hammer pattern. It is bullish reversal sign implying positive continuation sign.
Ratio Chart (Ultratech/Nifty 200)

Ratio chart shows compression in movement but on the edge of breakout. Rising line indicates outperformance of ultratech in compare to Nifty 200.
Fibonacci Extension

Application of Fibonacci Extension shows potential resistance near to 7900/8200, it coincides with previous turning levels.
Stock can oscillate in the range of 7200 to immediate support of 7000 level. Stock will retain positive view as far as sustain above 6700 level.


