Case Study: IT Sector and Wipro
View: Time-wise correction/Negative
Technical Learning
Nifty Chart analysis
Components of Nifty
Analysis of Sector performance
Ratio Chart analysis
IT Sector: Price-wise and Time wise characteristic
Strength analysis
Technical analysis on IT and Wipro
Nifty 50 Weekly Chart
With strong upside movement, Index neared previous reversal levels. It is a resistance level but not confirmed. If a reaction from resistance breaches the support level, it will indicate validation of support. In mentioned situation, from a broader perspective, Index will remain in the bulls zone as far as sustaining above the 18200 level. Closing above the 18400 level is a sign of a fresh resumption in an upside move.

Leading and laggard Sectors
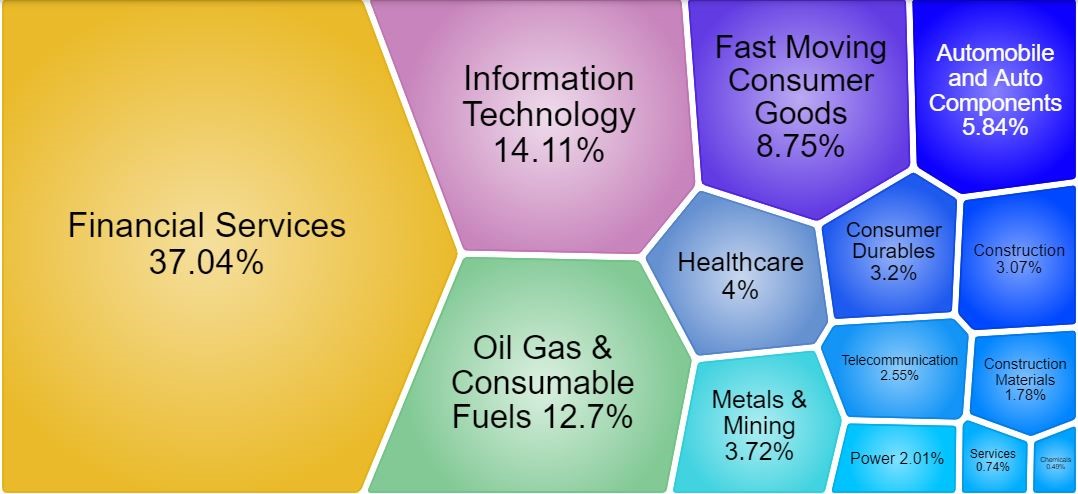
Before we look at leading and laggard sectors, let’s understand the composition of Nifty 50 from the sector and their respective weight.

It shows top 3 out of 14 sector weight around 65%. The index is highly skewed towards the Financial service, Information Technology and Oil and gas (Energy) sectors.
Sectoral Performance

The sectoral comparison chart indicates Nifty and financial service indices slope is upward while Nifty IT has a downward slope.
Nifty IT/ Nifty 200 Ratio Chart

As the ratio line is dropping, it indicates the underperformance of the numerator. In this case, the Numerator is Nifty IT. In a very recent context, the Ratio line has started to move upward but it is not a structural change yet.
Let’s have a look at the technical properties of the Nifty IT Sector
Nifty IT Sector from a Time perspective

Since the year 2007, It has been observed that, In a broader context, the Nifty IT sector moves to 2 year high followed by a 2-year decline or time-wise correction. Till now, Index has spent 1 year in decline move but as per cycle, it may have further time-wise or price-wise correction.
Nifty IT Sector from a Price perspective

Looking at the intensities of falls in the entire history of the IT sector, it has been observed that the majority of declines were in the range of 30% to 35% correction. Recent correction is in line with the previous fall. Looking at the IT sector from a price and time perspective, it seems that the IT sector still has a scope for time-wise correction.
Nifty IT Sector Weekly Chart

For the past 28 weeks, the Nifty IT index is in the range of 26500 to 30500 level. With the recent upside move, Index reached the upper band of consolidation showing potential resistance.
Let’s summarise, where we have reached so far…
We show Nifty 50 is at a resistance level but the underlying tone is positive.
The nifty IT sector is underperforming as the ratio line is dropping.
The nifty IT index has fallen in line with the previous fall but time-wise correction may persist.
IT index is reacting from the upper band of consolidation.
Let’s look at the components of the IT Sector

The price performance of Large cap IT Stocks

shared info is in-house “Strength Analysis” data which is used for comparing sector and price movement in comparison to the broader market in peer stock. We update this data on week on weekly basis and it is available on trade;able app.
As the IT index is at a resistance level, it is a good look at weak stocks in the IT space. Here, strength analysis plays a very important role as it demarcates strong stocks and weak stocks. In the recent upside move, it shows HCLTECH is doing well whereas Wipro is weak stock.
Wipro Daily Chart

As strength analysis indicates firm weakness vis a vis to peers, sector and the broader market. Technically, the Stock is under lower high and lower sequence and reacting from the upper arm of the falling channel, it denotes negativity.
The current market price (388) to 400 can be considered a weak zone. The negative view will be negated if the price move above the 420 level which is a key resistance level.
Wipro Monthly Chart:

For more than a decade, the stock is finding support at the long-term moving average. In the current context, the slope of the moving average and role reversal level coincides in the range of 320 to 300 level. The mentioned range can be considered as potential support from a positional perspective.


