Case Study on strength analysis of Chambal Fertilizer
Technical learning points
– Strength Analysis
– Price Action
– Top Down Approach
– Multiple time frame analysis
– Chart Pattern: Head & Shoulder pattern
Strength Analysis

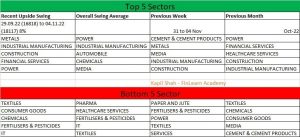
Looking at Bottom 5 sectors, Fertilizer & Pesticides comesin the category of recent upside swing, overall swing average and previous week. Repetitive occurrence of sector in various time frame under bottom 5 sector indicates weakness.
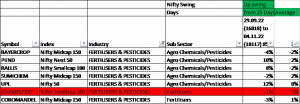
Fertilizer & Pesticides stocks in recent upside (Nifty)

In 8% upside move in Nifty, core fertilizer stocks like Chamblfert and coromandel performed in negative. It indicates weakness in the sector.
Chamblfert Monthly Chart

On monthly chart, stock has breached rising channel on lower side. In recovery attempts, stock witnessed selling pressure at role reversal level – broken support level acting as resistance. Stock has breached tiny rising trendline, indicates bearish continuation sign.
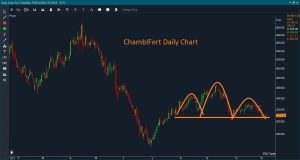
ChamblFert Daily Chart

Higher time frame indicates weak structure. On lower time frame like Daily chart, stock has formed Head & Shoulder pattern which is bearish pattern. As lower time frame chart formation is in sync with higher time frame (monthly chart), pattern’s predictive value increases. Moving below 300 level will confirm the pattern.
End Note:
- With strength analysis, We identified strong and weak sector.
- We looked at stocks with comparison with market and peers.
- We performed price action on higher time frame chart and sensed negative structure.
- On daily chart, we identified bearish reversal pattern.
- Point 3 and 4 is a multiple time frame analysis.
- Above resistance can be stop loss and immediate support can be considered as target.


