Role Reversal: Support becomes Resistance
Support band, or a support level, refers to the price level that does not fall below for some time. A support level is created by buyers entering the market whenever the asset dips to a lower price.
Let’s deep dive into the cycle of Role Reversal…
The support band can be marked by marking a band at the low on a particular time period daily, weekly or higher time frame. While marking a support band the candle which made the low is to be considered in the context of an expanded range candle or a narrow range candle.
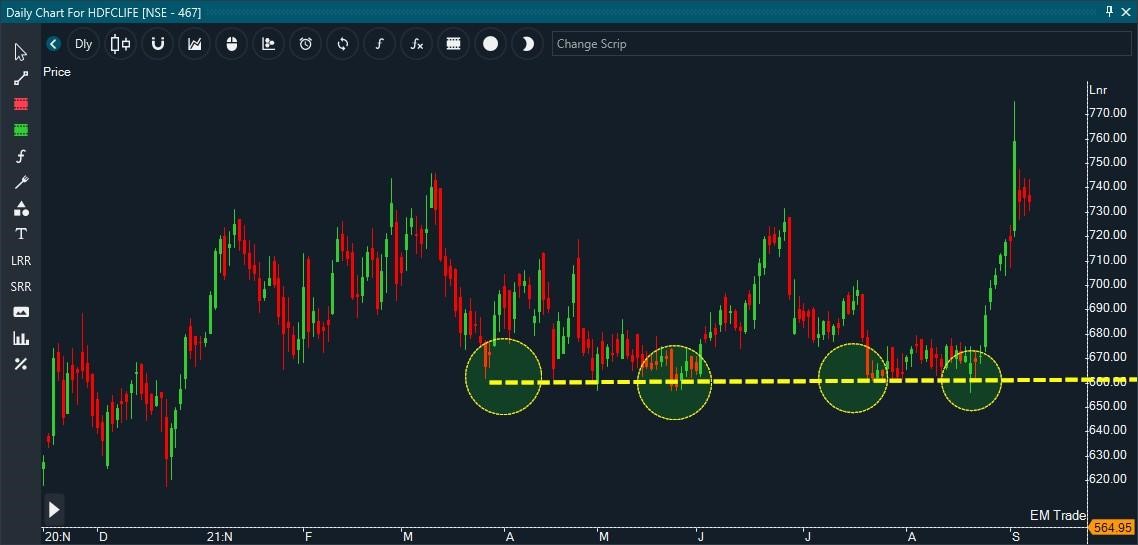
Support band provides a floor to a falling price. The price decline extends for some time then makes a low and reverses from a particular price point. This low is referred to as support.
In the chart below, the support band is marked. Notice how the support provided a floor to a falling price and prices reversed from the support level.
A resistance band, or a resistance level, refers to the price level that does not rise above for some time. A resistance level is created by sellers. The resistance band can be marked by making a band at the high on a particular time period daily, weekly or higher time frames. It can also be marked on lower intraday time frames.
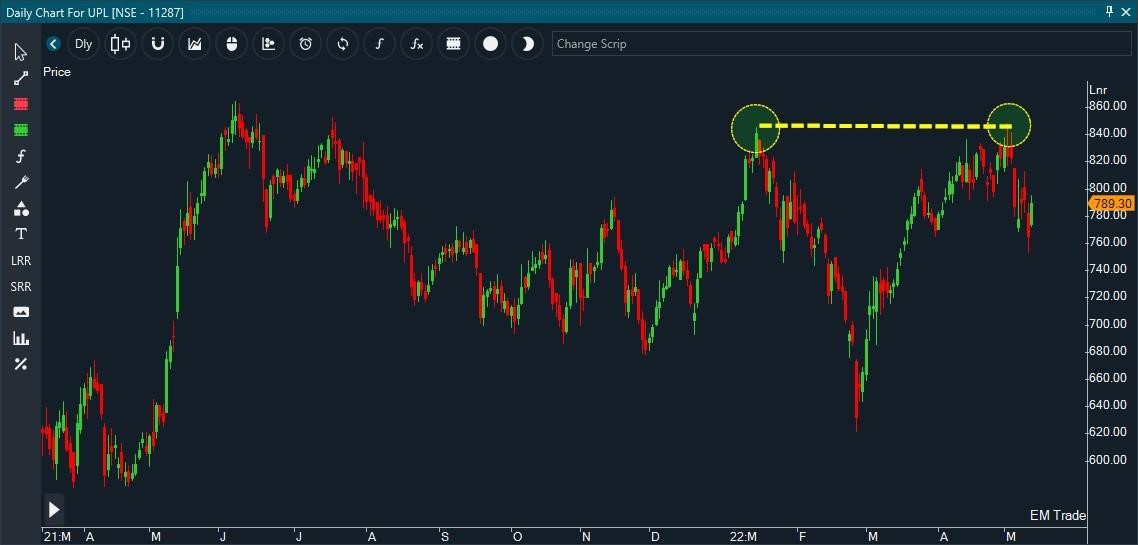
Resistance band provides a ceiling to a rising price. The price rise extends for some time then makes a high and reverses from a particular price point. The high is referred to as resistance.
In the below chart resistance is marked, resistance provides a ceiling to rising prices. Resistance suggests more sellers than buyers.
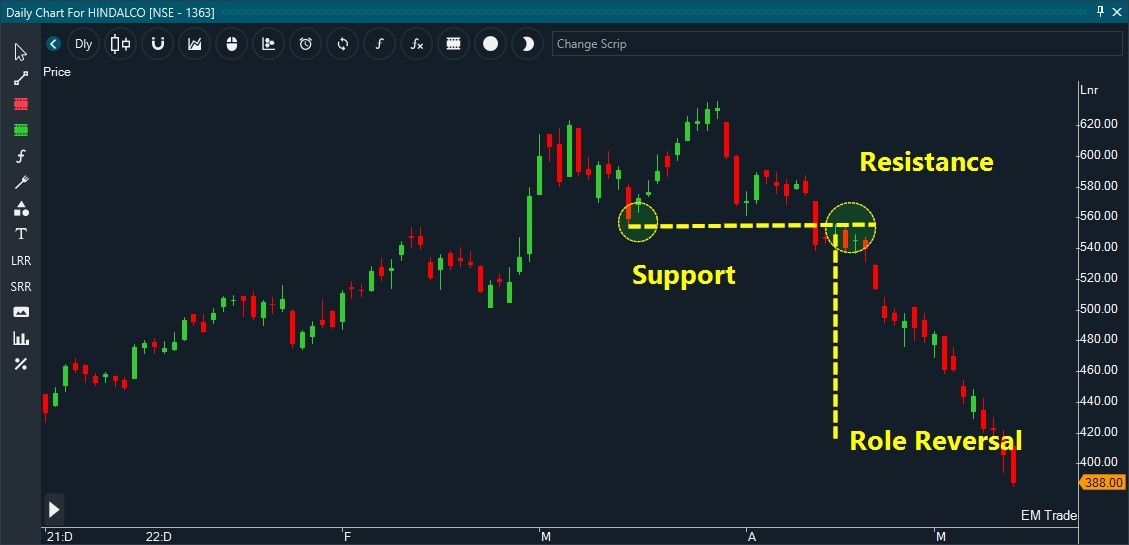
Role reversal means earlier what was a support level now violated or broken acts as a resistance. Role reversal is more relevant on higher time-frame like weekly and monthly charts. If there are role reversal levels traders should note them down and mark them in their trading plan. They provide a good opportunity to exit long trades and initiate fresh short sell trades.
Conclusion
- Role reversal, support once broken becomes resistance is a powerful trading technique applied on all time frame charts.
- You will usually find one opportunity every day on a 5- 15- 60 minute time frame in Nifty 50 stocks and actively traded F&O stocks
- Hop onto Trade: able and try out the Hindalco exercise to implement this concept now!


