10 stocks to track using Ichimoku Cloud
15Feb, 2023
FinLearn Academy
What is Ichimoku cloud?
The Ichimoku cloud is a type of chart used in technical analysis to display support and resistance, momentum, and trend in one view. Conversion lines and reference lines are similar to moving averages and are analyzed with each other.
- The Ichimoku Cloud Indicator consists of five components, each containing information about price movements
- Tenken Sen
- Kijun Sen
- Chikou Span
- Senkou Span
- The Cloud (KUMO)
Bullish trading strategy
To determine if the price is in an uptrend, there are certain criteria the Ichimoku Cloud indicator should follow:
Uptrend criteria:
- When the short-term indicator, TenkanSen, exceeds the long-term indicator, KijunSen, the stock trend is generally positive
- If the prices taken are above kijun sen then it indicates that the prices are in an uptrend
- Prices should be above Tenken and Tenkun should be above kijun
- Tenken and Kijun are both expected to be bullish
- Kijun should not be too far from the price
- Future Kumo should increase in price
- The price must be on kumo
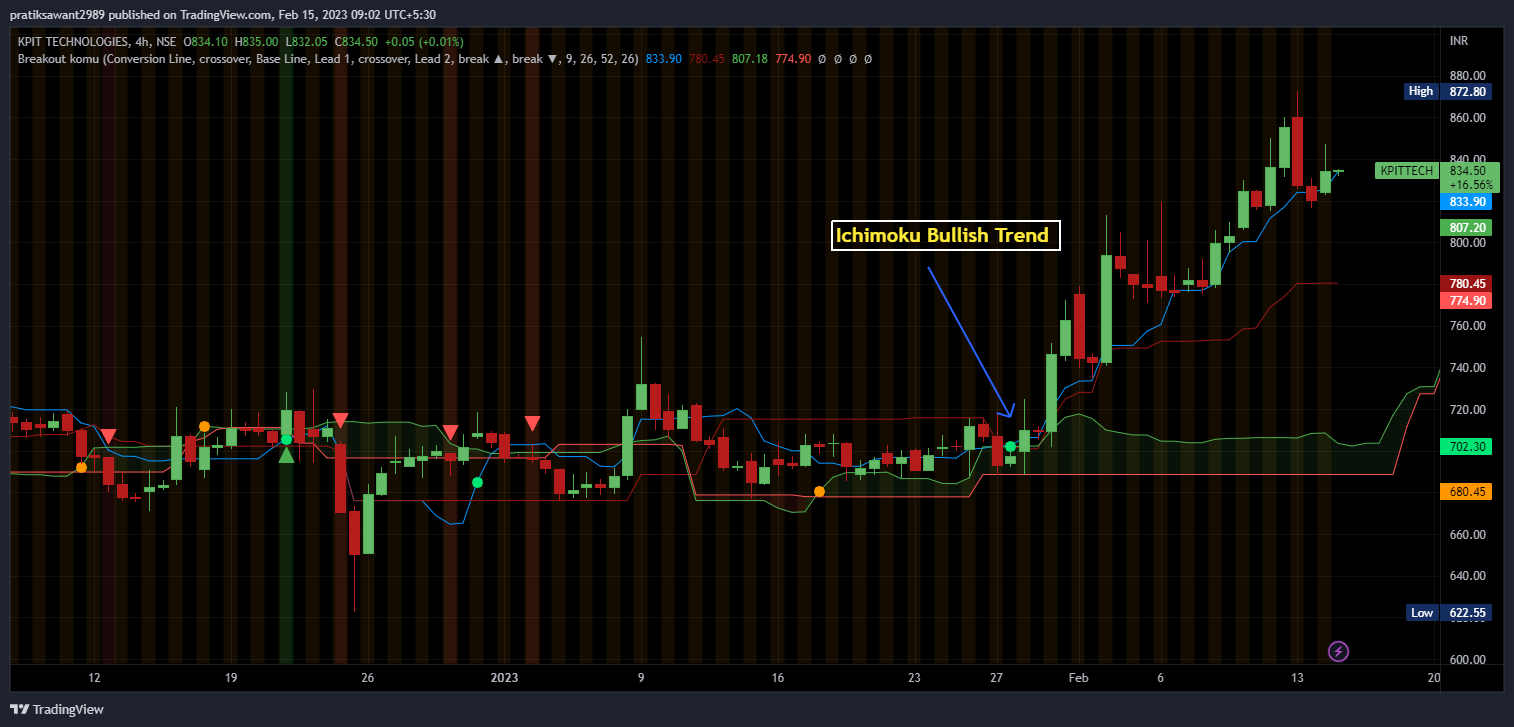
- Let’s look at an example in the chart below (on KPIT a 240 min time frame)

- 5 Buy calls generated by Ichimoku Bullish Trend
| Time | Scrip Name | Signal | Entry Rate |
| 07-02-2023 | ABB | BUY | 2993 |
| 14-02-2023 | TVS MOTOR | BUY | 1071 |
| 02-02-2023 | POONAWALA FIN | BUY | 288 |
| 31-01-2023 | INDIAMART | BUY | 4475 |
| 31-01-2023 | MOTHERSON | BUY | 75.90 |
Bearish Trading Strategy:
To determine if the price is in a Downtrend, there are certain criteria the Ichimoku Cloud indicator should follow:
Downtrend criteria:
- When TenkanSen falls below KijunSen, the stock trend is usually negative
- if the prices taken are below kijun sen then it indicates that the prices are in a downtrend
- Prices should be below Tenken and Tenkun should be below kijun
- Both Tenken and Kijun should be moving downwards along with the prices
- Kijun should be not too far from the price
- Future Kumo should be bearish
- Prices should be below kumo
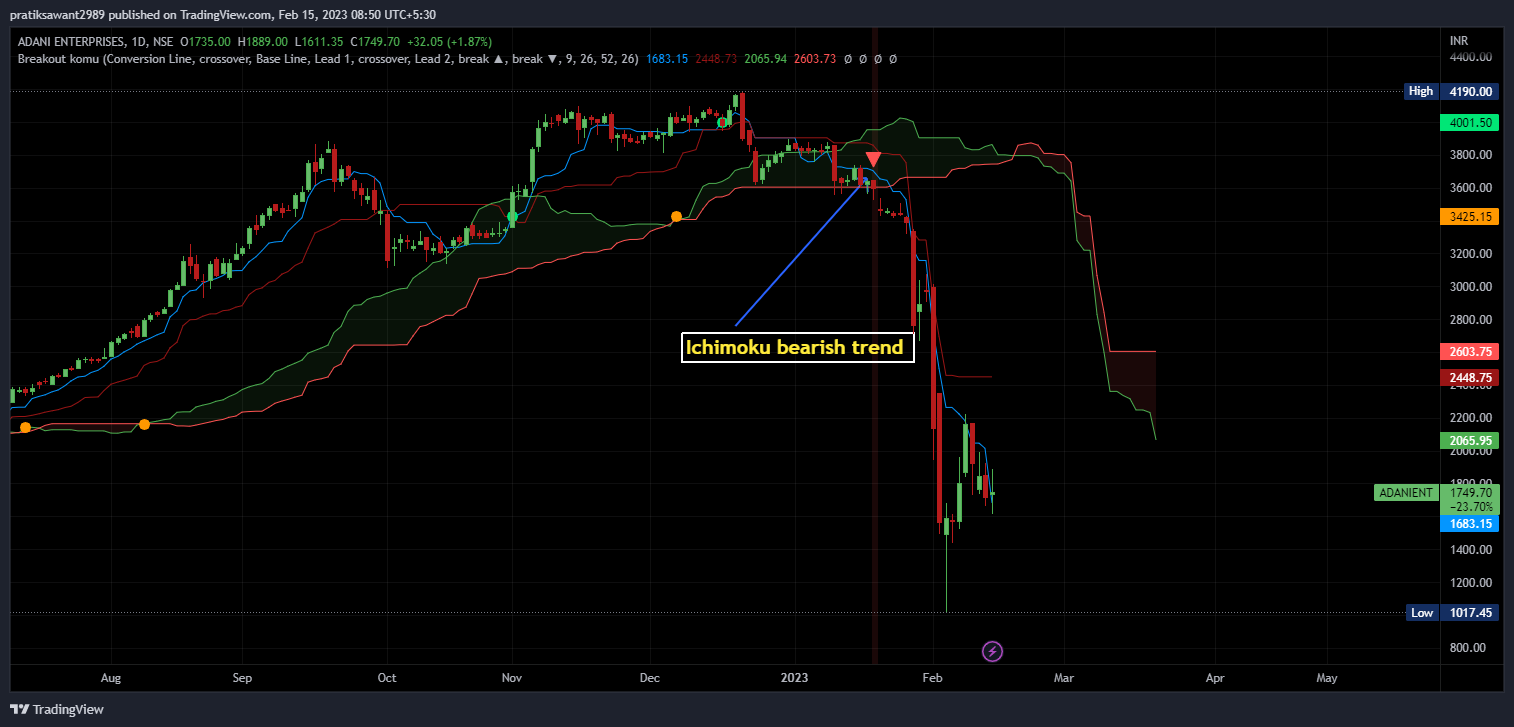
- Let’s look at an example in the chart below (on Adani Enterprises a daily time frame)

- Sell calls generated by Ichimoku Bearish Trend
| Time | Scrip Name | Signal | Entry Rate |
| 16-01-2023 | FORTIS | SELL | 287 |
| 13-02-2023 | LUPIN | SELL | 721 |
| 01-02-2023 | HDFCLIFE | SELL | 590 |
| 27-01-2023 | LICI | SELL | 675 |
| 18-01-2023 | ADANIENT | SELL | 3608 |
Awesome, but what’s my takeaway?
- ABB, TVS MOTOR, POONAWALA FIN, INDIAMART & MOTHERSON have given a buy call on a daily time frame (Ichimoku Bullish trend )
- FORTIS, LUPIN, HDFCLIFE, LICI & ADANIENT have given a sell call on a daily time frame (Ichimoku Bearish Trend)


